




IB Maths IA idea · Probability and statistics
Simpson's paradox: when the overall trend lies
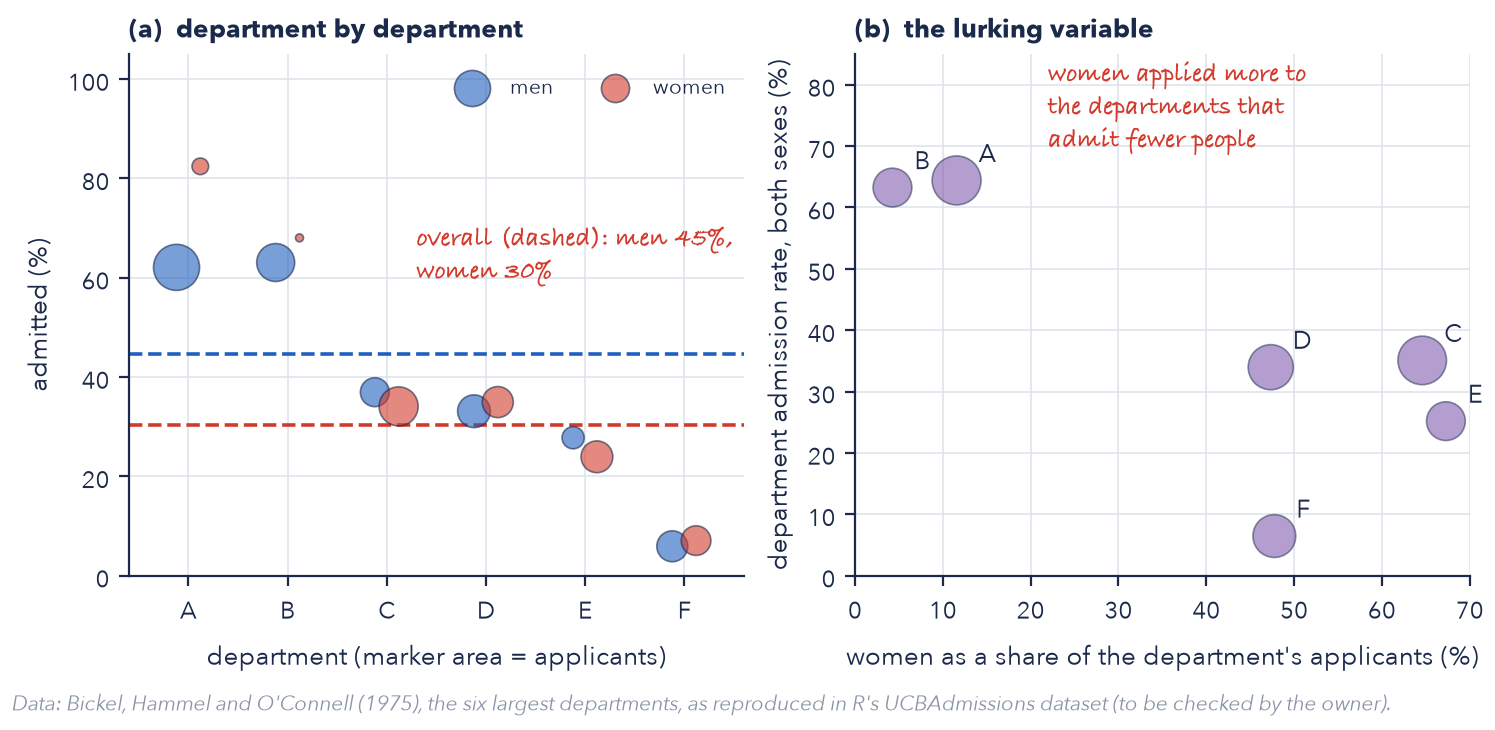
In a famous set of university admission figures, men were admitted at a clearly higher rate than women overall, yet in most departments women did as well or better. Both statements are true.
These ideas are starting points, not an IA to copy. Never copy an idea blindly: make the question, method and analysis your own, and check your plan with your teacher.
The big idea
A group's overall rate is a weighted average of its rates in each subgroup, and the weights are the numbers of people in each. Two groups can have different weights. If one group applies mostly to subgroups with low rates, its overall rate drops even when it does better inside every subgroup. That is Simpson's paradox: a trend that reverses when groups are combined. You write conditional probabilities for each subgroup and for the whole, show exactly how the weights cause the reversal, and find what is needed for it to happen. The real question is which number answers your question. Decide which comparison is fair, and justify it; that judgement, not the arithmetic, is where the high marks are.
The maths you will use
- Conditional probability. Find and from counts, and compare each pair.
- Law of total probability. Write for each group and read the weights off the table.
- Weighted averages. Show how a group's overall rate changes with the share of applicants to the hard department, as a straight line in that share.
- Inequalities. Derive the conditions on four rates and two shares that give a reversal, and test them with numbers.
- Standardisation. Apply the same weights to both groups and compare the standardised rates; optionally test independence with a chi-squared test (AI).
Key equations
The maths in action
Example research question
In published admission figures for six university departments, how can men's overall admission rate be higher than women's while women's rate is higher in most departments, and does giving both groups the same department weights remove the gap?
Change the context, the data or the method so the question is yours. Our Maths IA guide shows how to check it.
Check your research question
- Names the table or tables, the groups being compared and the outcome.
- Says which rates you will compute: overall, by subgroup, and a standardised rate.
- Says what question the data are meant to answer, because that decides which rate is the fair one.
- Goes beyond showing one reversal: there is a formula, a condition or a fair-comparison method.
- Is careful about causes: the data show associations, and you say what you cannot conclude.
Which course it fits
- AA SL ideal
- AA HL ideal
- AI SL ideal
- AI HL ideal
Syllabus links in Maths AA:
- AA 4.5 Basic probability and expected frequency
- AA 4.6 Venn and tree diagrams, combined events
- AA 4.11 Conditional probability and independence
- AA 4.13 Bayes' theorem (HL only)
Steps
- Read and predict. Find out what Simpson's paradox says. Before any calculation, guess whether the overall trend in your chosen table will match the subgroup trends.
- Choose the table. Pick a published two-way table with counts, not just percentages. Say what the groups, subgroups and outcome are.
- Check the arithmetic. Check that the subgroup counts add up to the totals, and recompute two of the quoted percentages by hand.
- Trial run (1 lesson). Compute overall and subgroup rates in a spreadsheet and see whether the trend reverses. If it does not, choose a different table now.
- Write the weights. Write each overall rate as a weighted average of subgroup rates and show which weights cause the difference.
- Standardise. Recompute both groups' overall rates with the same weights for both. Compare with the raw rates and decide which is fairer for your question.
- Find the conditions. Derive when a reversal can happen for two groups and two subgroups, and test the conditions on invented tables.
- Go further, with a reason. Add a second table, or simulate how often reversals occur. HL: this is where the rigour for criterion E comes from.
- Reflect as you go. After every result, write one line on what it means for the original question and what it assumes. These lines become your evaluation.
- Cut, check, then send. Check every table is labelled, every symbol is defined once and the conclusion answers your aim. Then send your teacher one draft.
Make it yours
- Rebuild the paradox from a table. Take a published two-way table, compute the overall rates and the rates within each subgroup, and show the reversal.
- Weighted averages. Write each overall rate as a sum of subgroup rates times subgroup shares and show which shares cause the reversal.
- Fair-comparison rate. Give both groups the same subgroup weights (for instance the total applicants) and recompute the overall rates.
- Find the conditions. Derive what must be true of the rates and weights for the reversal, with two groups and two subgroups.
- How common is it?. Simulate many random two-by-two-by-two tables and count how often a reversal occurs.
- A second example. Find a second real table, such as medical treatments, and test whether the lesson is the same.
HL extension
Prove the conditions for a reversal in general, derive the standardised rate, and discuss when the subgroup comparison or the overall comparison is the causally appropriate one.
The data you need
Use the published Berkeley admission counts by department and sex, and a second table such as the kidney stone treatment data.
Traps
- Giving the paradox as a trick without showing the weights that cause it.
- Saying the overall rate is simply wrong. It is correct; it answers a different question.
- Concluding bias or discrimination from rates alone. Rates show associations, not reasons.
- Using percentages from a source without the counts, so the weights cannot be checked.
- Averaging the subgroup percentages instead of weighting them by the numbers in each subgroup.
- Choosing subgroups after seeing the data so the reversal appears.
More Maths IA ideas in Probability and statistics
- Card and dice games: what is the best strategy?In the Photon IA Guide
Every game has a rule that decides whether the house or the player wins in the long run. You're going to find it and then test it by playing.
- Sleep and test scores: how strong is the evidence?In the Photon IA Guide
Everyone says "get more sleep". You're going to ask how strong the link to marks really is, and how sure you can be that it isn't just chance.
- How many fish are in the pond? Capture-recaptureIn the Photon IA Guide
How do ecologists count fish they cannot see all at once? Catch some, mark them, release them, then catch again and see what fraction are already marked.
- Goals and tries: are they random?Free with an account
Football goals and rugby tries seem to arrive without warning. If they really do, a Poisson model should predict how many 0–0 draws and 4–3 thrillers a season holds. Does it?
- Screening tests: why a positive can still be wrongIn the Photon IA Guide
A test that is right 90% of the time says you have a rare condition. Are you probably ill? Your first instinct will be wrong, and showing why is the whole IA.
- Lotteries: is a ticket ever worth buying?In the Photon IA Guide
A 6-from-49 lottery has 13,983,816 possible tickets, so one ticket has a chance of about 1 in 14 million. Is there a jackpot big enough that the average ticket stops losing money?
- When should you stop looking? The 37% ruleFree with an account
You will see 100 candidates, one at a time, and must accept or reject each on the spot. There is a rule that picks the single best one more than a third of the time, and its cut-off is about 37% of the way through.
- Waiting times: does a Poisson model fit?In the Photon IA Guide
You've waited for a bus that took forever. Is that bad luck, or exactly what a random process predicts? Count, time and test.
- Polls: how big a sample shrinks the margin of error?In the Photon IA Guide
A poll of 1,000 people claims to speak for millions. You're going to find out exactly how much confidence that deserves, and where it runs out.
- Benford's law: does your data follow it?In the Photon IA Guide
In many real data sets, about 30% of numbers start with 1 and fewer than 5% start with 9. Does your data play along, and what happens when it doesn't?
- Shop queue: predict its length from arrivalsIn the Photon IA Guide
You stand in a queue and wonder why it's never short. You're going to count it, model it, and find out why a busy till is worse than it looks.
- Markov chains: what is the long-run weather?In the Photon IA Guide
Will it rain tomorrow if it rained today? Where will you be on the board after 100 turns? Matrices can say, if you're careful about what they assume.
Other free Maths IA ideas
- The rule of 72: how good is it, and why 72?
- Setting a price: how to maximise profit from real data
- The birthday problem: how safe are hash codes?
- Walk every bridge once: from Königsberg to your city
- Where should a screen be mounted? The best viewing angle
- How old is it? Radiocarbon dating and its errors
- From rally to match: how small edges become big wins
- Day length: how does latitude change the year?
- Bouncing ball: how far does it travel in total?
- Drawing a shape with functions: how close can you get?
- Newton's method: how fast, and when does it fail?