




IB Maths IA idea · Geometry, maps and space
Day length: how does latitude change the year?
Near the equator, day length barely changes all year. Near the Arctic Circle, it swings from almost nothing to almost everything. One equation explains both, and the tilt of the Earth is in it.
These ideas are starting points, not an IA to copy. Never copy an idea blindly: make the question, method and analysis your own, and check your plan with your teacher.
The big idea
The Earth's axis is tilted, so the Sun's angle above the equator, the declination, changes through the year in a smooth, sine-like way. Combine that with your latitude and a little spherical geometry and you can get the exact time between sunrise and sunset as a function of the day of the year. You can also ignore the physics and fit a sine curve to real sunrise tables. Which model is better, and where does each break? The formula is routine. The marks come from testing it: fit both models to real data, measure the residuals, explain the places they fail (polar day, twilight, atmospheric refraction) and say what you would change.
The maths you will use
- Sinusoidal model of declination. Write the declination as degrees and explain each number.
- Trigonometry on a cross-section. From the sunrise geometry, derive and day length hours.
- Fitting a sine curve. Fit to real day lengths, with technology, and read off the amplitude and shift.
- Residual analysis. Plot residuals of each model against the day of the year; compare the largest errors in minutes.
- Rate of change. Differentiate the model to find minutes gained per day and the day it is largest (AA HL: with inverse trigonometry).
Key equations
The maths in action
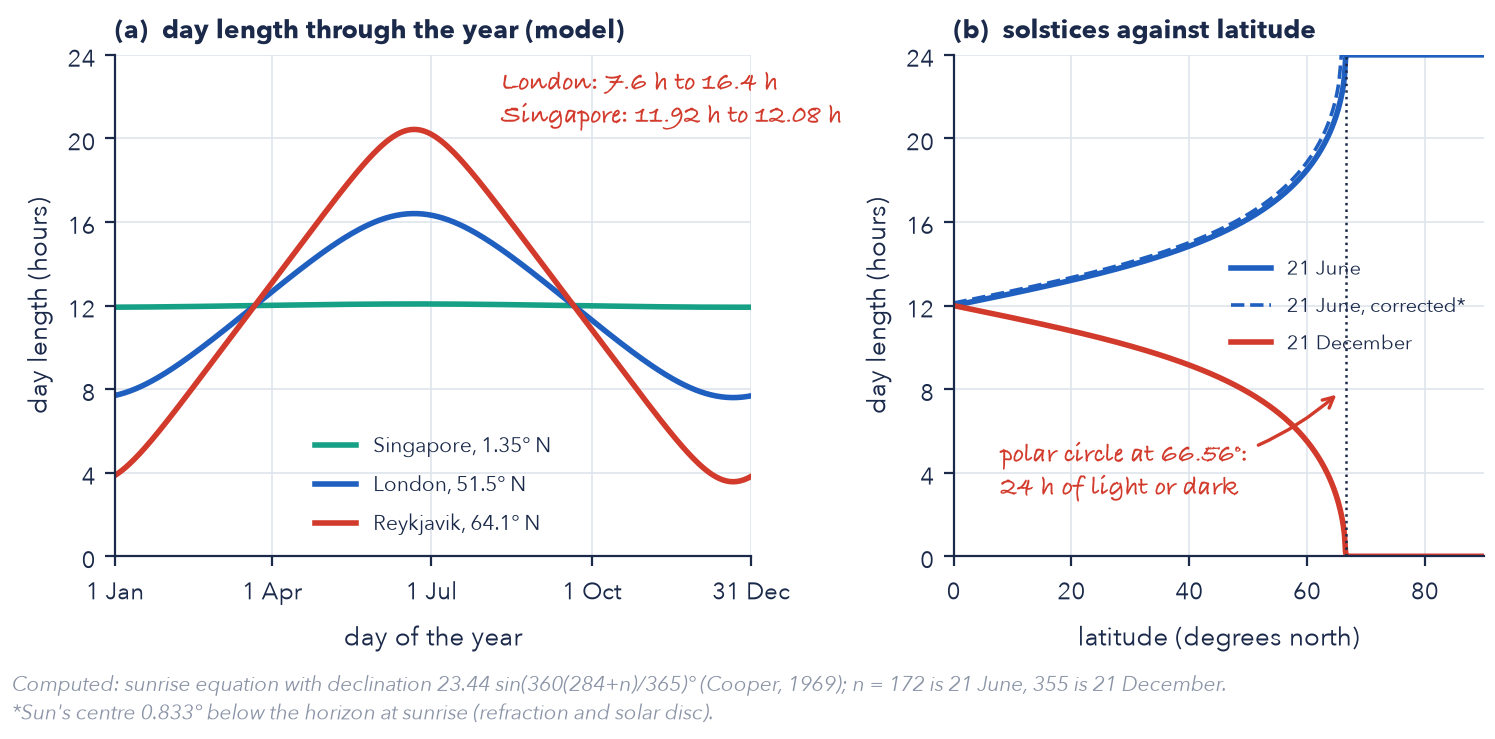
Example research question
For two places at different latitudes, how well does a day-length model built from the sunrise equation and a sinusoidal declination match a year of real sunrise and sunset times, and how does it compare with a sine curve fitted directly to the data?
Change the context, the data or the method so the question is yours. Our Maths IA guide shows how to check it.
Check your research question
- Names the places and the year of data, and where the sunrise and sunset times come from.
- Names the model or models you compare and what each parameter means.
- Says how you will judge the fit: a residual measure, or the largest error in minutes.
- Says what 'sunrise' means in your data and your model, since they may not match.
- Is narrow enough for 12 to 20 pages and goes beyond fitting one sine curve once.
Which course it fits
- AA SL ideal
- AA HL ideal
- AI SL ideal
- AI HL ideal
Syllabus links in Maths AA:
- AA 2.10 Solving equations graphically and analytically
- AA 3.4 Radians, arc length and sector area
- AA 3.5 Unit circle definitions of sine, cosine and tangent
- AA 3.7 Circular functions and their graphs
- AA 3.8 Solving trigonometric equations
- AA 3.9 Reciprocal and inverse trigonometric functions (HL only)
- AA 5.6 Standard derivatives; chain, product and quotient rules
Steps
- Read and predict. Find out what declination is. Before any calculation, guess how the swing in day length changes as you move away from the equator.
- Choose places and data. Pick two or three places at different latitudes, and download a full year of sunrise and sunset times from a source you can cite.
- Clean the data. Convert times to hours, compute day length, and decide what to do with time zones and clock changes.
- Trial run (1 lesson). Plot one year of day length for one place and fit a sine by hand. Fix any problem now: units, time zone, the start of the year.
- Derive the physical model. Draw the cross-section, derive the day length from latitude and declination and check it on the equinox and the solstices.
- Compare the models. Put the fitted sine and the physical model on one graph with the data, and measure the residuals of each.
- Go further, with a reason. Pick one extension: the rate of change, polar day, or a refraction correction. Say why it adds to your question.
- Reflect as you go. After every result, write one line on what it means for a real place and what it assumes. These lines become your evaluation.
- Cut, check, then send. Check every graph has labelled axes with units, every symbol is defined once and the conclusion answers your aim. Then send your teacher one draft.
Make it yours
- Derive from the geometry. Draw the Earth in cross-section and work out the length of the day from the latitude and the Sun's declination.
- Fit a sine to real tables. Take a year of sunrise and sunset times for one place and fit a sine curve to day length by hand or with technology.
- Two places, one model. Compare a place near the equator with one at a high latitude using the same formula.
- Rate of change of day length. Find how many minutes per day the day length changes, and when that rate is largest.
- Polar day and night. Find the latitude where the Sun stays up on the solstice, and how many days of midnight sun a place gets.
- Include refraction. Replace 'the Sun's centre is on the horizon' by a more realistic sunrise definition and see how the day lengths change.
HL extension
Differentiate the day length to find the rate of change and show it is largest at the equinoxes, handle the polar cases with a piecewise model, and add a refraction correction to measure how much better it fits the data.
The data you need
A full year of sunrise and sunset times for two or three places from a public almanac or calculator, converted to day length in hours.
Traps
- Fitting a sine curve with the wrong period, or leaving the shift out and getting the longest day in March.
- Putting a calculator in degrees for one step and radians for the next.
- Using clock time, with daylight saving changes, as if it were solar time.
- Forgetting that the inverse cosine is undefined when the Sun never sets or never rises.
- Calling a sine fit 'proved' because R-squared is high, without looking at the residuals.
- Not saying what counts as sunrise in the data you use.
More Maths IA ideas in Geometry, maps and space
- Honeycomb: why do bees use hexagons?Free with an account
Everyone says bees are brilliant mathematicians. You're going to test the claim and find out what is actually true.
- Building height from angles: how accurate is it?In the Photon IA Guide
Anyone can write H = d tan θ. The real question is how far you can trust the answer, and which measurement lets you down first.
- Why do long flights curve? Great circlesIn the Photon IA Guide
On a flat map, the shortest way from Asia to Europe looks like a straight line. On the globe it isn't, and the flight that looks curved is the shorter one. How much shorter, and where does it matter most?
- How does a phone find itself? TrilaterationIn the Photon IA Guide
Your phone doesn't know where it is. It only knows how long signals took to arrive from points it can't see. From those times it finds a spot on the Earth, and the geometry of the beacons decides whether that spot is good.
- Orbits and ellipses: how well does an ellipse fit?In the Photon IA Guide
Kepler spent years on Mars's orbit. You're going to fit an ellipse to real positions and find out how good the fit really is.
- Gravitational time dilation: how good is a Maclaurin approximation?Free with an account
GPS satellites carry clocks that gain about 38 microseconds a day compared with clocks on the ground. That tiny gap comes from a square root, and the square root is almost always replaced by a short series. How short can it be?
- Map projections: how do they distort the world?In the Photon IA Guide
Greenland looks as big as Africa on many maps. You're going to put numbers on exactly how wrong that is, and why.
- Roots of unity: a pentagon by ruler and compass?In the Photon IA Guide
A regular pentagon can be drawn with only a ruler and a compass. A regular heptagon cannot. The reason sits inside the complex numbers, and you're going to find it.
Other free Maths IA ideas
- The rule of 72: how good is it, and why 72?
- Setting a price: how to maximise profit from real data
- The birthday problem: how safe are hash codes?
- Walk every bridge once: from Königsberg to your city
- Where should a screen be mounted? The best viewing angle
- How old is it? Radiocarbon dating and its errors
- Simpson's paradox: when the overall trend lies
- From rally to match: how small edges become big wins
- Bouncing ball: how far does it travel in total?
- Drawing a shape with functions: how close can you get?
- Newton's method: how fast, and when does it fail?