



IB Maths IA idea · Art, music and design
Drawing a shape with functions: how close can you get?
A picture is just a set of curves, if you are patient enough to write them down. You're going to rebuild your own drawing from functions, and then find out how close you really got.
These ideas are starting points, not an IA to copy. Never copy an idea blindly: make the question, method and analysis your own, and check your plan with your teacher.
The big idea
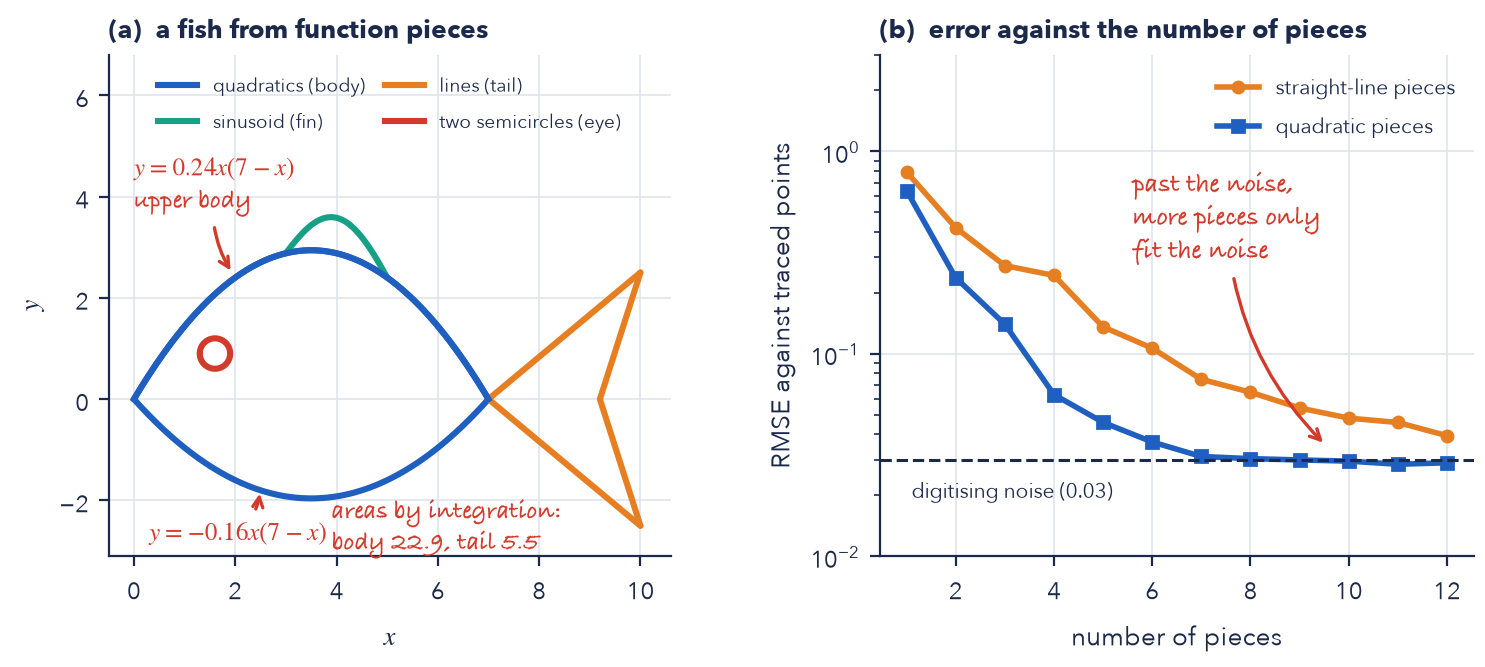
Place axes over a drawing you made, read points off its outline and write each piece as a function with a limited domain: a line, a quadratic through three points, a sine curve stretched to fit. Three points give a 3 × 3 system, and transformations let one sine or one parabola be moved, stretched and flipped into place. Then comes the part many drawings skip. Measure the gap between your picture and the original, piece by piece. A root-mean-square error turns a feeling that it looks right into a number. Ask how many pieces are enough: where do extra pieces stop helping, and what do they cost? You can also find areas by integration.
The maths you will use
- Quadratics from three points. Solve the system for , , so that passes through three points read from the outline.
- Transformations. Fit with stretches and shifts read from the image, and justify each parameter.
- Piecewise functions. Write each piece with its domain, check the pieces meet at the joins and decide whether a corner is acceptable.
- Error measure. Calculate for each piece and for the whole edge.
- Definite integrals. Find the area between an upper and a lower curve by integrating, and compare with the area from counting squares.
Key equations
The maths in action
Example research question
How closely can lines, quadratics and sine curves with restricted domains reproduce the outline of a shape I drew, measured by the root-mean-square error against points read from it, and how many pieces does each edge need?
Change the context, the data or the method so the question is yours. Our Maths IA guide shows how to check it.
Check your research question
- Names the image, which you drew or whose creator allows your use, and how you will put axes over it.
- Says which function types you will use and why each suits its part of the picture.
- States the error measure and the points it will be calculated from.
- Says how you will compare designs: the number of pieces, the error and the effort.
- Is narrow enough for 12 to 20 pages: one drawing, fully analysed, rather than many drawings briefly.
Which course it fits
- AA SL ideal
- AA HL ideal
- AI SL ideal
- AI HL ideal
Syllabus links in Maths AA:
- AA 2.1 Straight lines
- AA 2.6 Quadratic functions
- AA 2.11 Transformations of graphs
- AA 3.7 Circular functions and their graphs
- AA 5.11 Definite integrals and areas between curves
- AA 1.16 Systems of up to three linear equations (HL only)
Steps
- Read and predict. Look at your drawing and guess which edges are lines, which are curves and which will be hardest.
- Draw your own image. Use a simple original shape you drew. Do not trace a copyrighted character, logo or artwork.
- Set the axes. Lay axes over the image, choose a scale and read at least a dozen points off the outline. Say how precise your readings are.
- Trial run (1 lesson). Build one edge with one or two pieces in Desmos. Check it against the image before drawing the rest.
- Fit the pieces. Fit each piece by hand: a line by two points, a quadratic by a 3 × 3 system, a sine curve by transformations. State each domain.
- Measure the error. Define your error measure, then calculate it for each piece and for the whole edge.
- Vary the pieces. Redraw one edge with more and fewer pieces and plot the error against the number used.
- Go further, with a reason. Find an area by integration and check it another way, or rotate a piece. HL: justify each step and compare two methods.
- Reflect as you go. After every result, write one line on what it means for how good your drawing is and what you assumed. These lines become your evaluation.
- Cut, check, then send. Check every function has a stated domain, every graph has labelled axes and the conclusion answers your aim. Then send your teacher one draft.
Make it yours
- Fit a piece through three points. Read three points off the outline and solve for the quadratic that passes through them.
- Move a sine curve into place. Fit a sine curve to a wavy edge using amplitude, period, shift and vertical shift.
- Measure your error. Compare each piece with points read from the original and find the root-mean-square error.
- Pieces against accuracy. Redraw one edge with 1, 2, 3 and more pieces and plot the error against the number of pieces.
- Find an area. Find the area of a region of your drawing by integrating the pieces and compare it with the area from a pixel count.
- Rotate the picture. Rotate one piece through an angle and write its new equation.
HL extension
Set up and solve the 3 × 3 systems algebraically, justify the error measure, compare line and quadratic pieces in terms of how error scales with the number of pieces, and rotate a piece with a rotation of the axes.
The data you need
Points you read from your own drawing, using Desmos or GeoGebra with the image placed behind the axes.
Traps
- Tracing a copyrighted character or logo. Use a shape you drew or one that is free to use.
- Writing a piece's equation with no domain, so the pieces overlap.
- Judging success by eye with no error measure.
- Adding pieces until the picture looks right without asking what each piece costs.
- Ignoring the reading error: you cannot be more accurate than your points.
- Showing screenshots of Desmos but no working for how each function was found.
More Maths IA ideas in Art, music and design
- Bridge arch: is a cubic or quartic a real shape?In the Photon IA Guide
Software will fit a cubic, a quartic, a degree-9 monster to your arch and give you a lovely R². The real question is which one deserves belief.
- Golden ratio claims: do they hold up?In the Photon IA Guide
Some people see the golden ratio in everything. You're going to measure, and find out whether it is really there.
- Tuner app: how does pitch change with string tension?Free with an account
Tighten a guitar string and the note rises. But by how much? You're going to turn a tuner app into a data logger, and let the data pick the function.
- Fonts and logos: how do Bézier curves work?In the Photon IA Guide
The letters on this page are made of curves, and each curve is stored as just three or four points. You're going to find out how four points make a smooth curve.
- Fourier series: what is in a musical note?In the Photon IA Guide
A flute and a violin can play the same note and sound completely different. You're going to find the maths of the difference.
- The pitch of a drum: radius, tension and loadingFree with an account
Strike a drum and you hear one note, but the head is vibrating in many ways at once. You're going to test what sets the lowest note and why a small weight at the centre changes it.
- The Mandelbrot set: which numbers stay bounded?In the Photon IA Guide
Square a number, add a constant, repeat. For some constants the numbers blow up, for others they stay put, and the border between them is infinitely detailed. You're going to find part of that border exactly.
Other free Maths IA ideas
- The rule of 72: how good is it, and why 72?
- Setting a price: how to maximise profit from real data
- The birthday problem: how safe are hash codes?
- Walk every bridge once: from Königsberg to your city
- Where should a screen be mounted? The best viewing angle
- How old is it? Radiocarbon dating and its errors
- Simpson's paradox: when the overall trend lies
- From rally to match: how small edges become big wins
- Day length: how does latitude change the year?
- Bouncing ball: how far does it travel in total?
- Newton's method: how fast, and when does it fail?