




IB Maths IA idea · Banking, markets and economics
Setting a price: how to maximise profit from real data
Raise the price and you sell less. Lower it and you earn less per sale. Somewhere between is the best price, and you're going to find it from real data.
These ideas are starting points, not an IA to copy. Never copy an idea blindly: make the question, method and analysis your own, and check your plan with your teacher.
The big idea
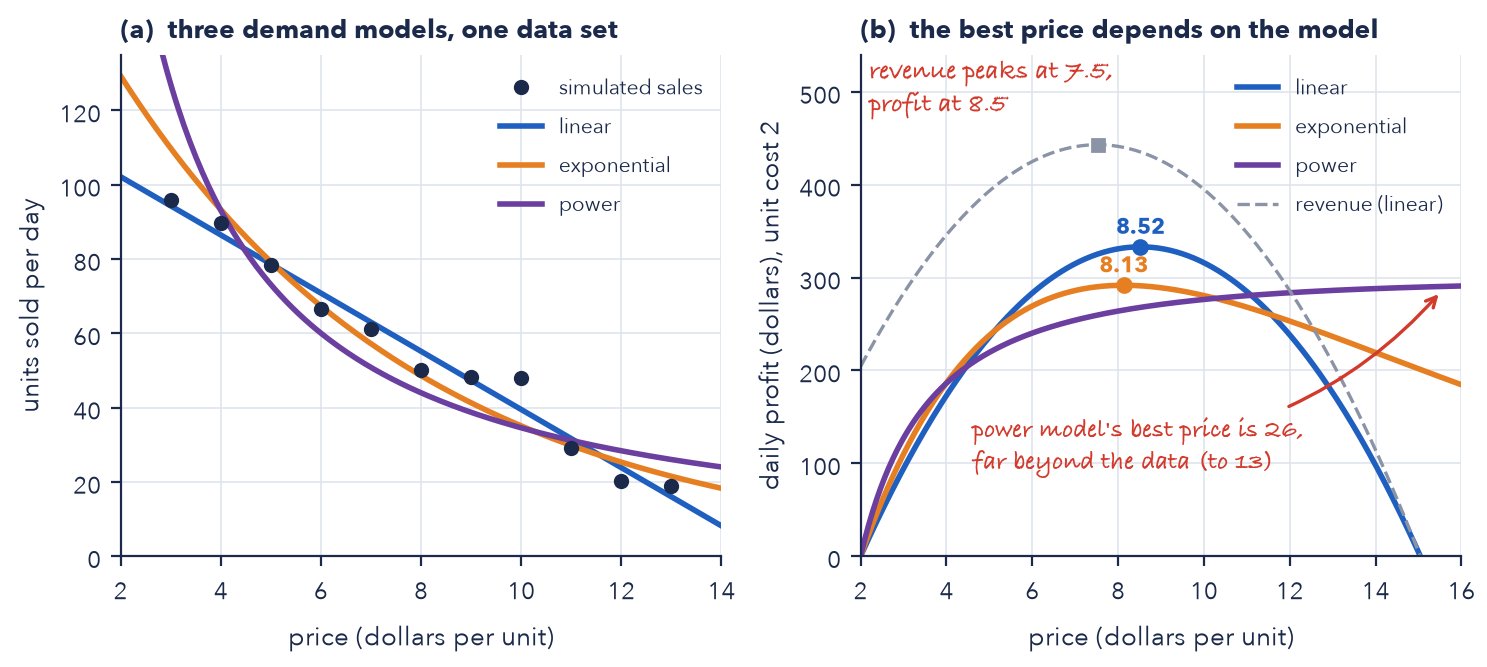
Demand data links price p to the quantity q people buy. Fit a model q = f(p); then revenue is pq and profit is (p − c)q for a unit cost c. Differentiate, and the best price is where the gradient is zero. The mathematical heart is your choice of demand model (a line? an exponential decay? a power law?) and what that choice does to the answer. Use real data, justify your model with residuals, and test how sensitive the best price is to uncertainty in the data. At HL, bring in price elasticity or a non-linear demand function, and prove the stationary point is a maximum.
The maths you will use
- Regression for demand. Fit , and to price and sales data, and judge each by its residuals.
- Revenue and profit functions. Build and with unit cost , and state the domain where they make sense.
- Differentiation and optimisation. Solve , prove it is a maximum with , and compare with the revenue maximum.
- Price elasticity. Compute and show that the profit maximum satisfies .
- Sensitivity analysis. Change each coefficient by 10%, or refit with points removed, and measure the percentage change in the best price.
Key equations
The maths in action
Example research question
For one product sold at 8 or more different prices, which of a linear, an exponential and a power demand model fits the sales data best, and how far does the profit-maximising price change from one model to another and when the data are perturbed?
Change the context, the data or the method so the question is yours. Our Maths IA guide shows how to check it.
Check your research question
- Names the product, the market and where the price and quantity data come from.
- Names the demand model(s) you will fit and how you will judge them.
- Says what the objective is, revenue or profit, and which costs are included.
- Says how you will test the answer: sensitivity to the data, a second model, or a real check.
- Is narrow: one product, one market and enough price points (at least 6 to 8).
Which course it fits
- AA SL ideal
- AA HL ideal
- AI SL ideal
- AI HL ideal
Syllabus links in Maths AA:
- AA 2.1 Straight lines
- AA 2.9 Exponential and logarithmic functions
- AA 4.4 Correlation and the regression line of y on x
- AA 5.3 Differentiating powers of x
- AA 5.7 Second derivative and graph behaviour
- AA 5.8 Maxima, minima, inflexion and optimisation
Steps
- Read and predict. Sketch the demand shape you expect and say which price you think wins. Write down why.
- Find or collect the data. Choose a source you can explain. Check you have at least 6 to 8 different prices with matching quantities.
- Trial run (1 lesson). Plot the data and fit a line in a spreadsheet. Is the scatter reasonable? Are there outliers to decide about?
- Choose the demand model. Fit two or three models. Use residuals, not R² alone, and say which you pick and why.
- Build the functions. Define revenue and profit for your chosen model. State unit cost, and anything fixed.
- Differentiate. Find the best price by hand, and show it is a maximum. Check against the graph and the data's range.
- Test the sensitivity. Change one input at a time and re-solve. Rank the effects.
- Go further. SL: a second model or a cost change. HL: elasticity or a non-linear demand function, with a justified optimum.
- Write, then cut. Write in layout order. One worked derivation, then a table of results.
- Check before your teacher's draft. Check notation, units, rounding to a sensible accuracy for the data, and reflection all the way through.
Make it yours
- Pick a real market. A tuck shop, a bake sale, a second-hand listing site, or published prices and sales for a product.
- Compare demand models. Linear, exponential and power.
- Use elasticity. Compute price elasticity of demand and look at where it equals −1.
- Add costs. A fixed cost, a variable cost, a bulk discount.
- Test the sensitivity. Re-fit with some points removed, or change each coefficient by 10%.
- Test it for real. A small survey: would you buy at this price?
HL extension
Prove the elasticity condition for the profit maximum, show that for a power demand model the best price depends only on and and exists only if , and bound the best price using the uncertainty in the fitted coefficients.
The data you need
Record price and quantity sold for one product at 8 or more prices, from a stall, a school shop, an online listing site or a small survey, and say how the data were collected.
Traps
- Maximising revenue when you meant profit: they are different questions with different answers.
- Choosing the demand model because the software offered it, with no look at residuals.
- Extrapolating the fitted line far outside the data (negative sales, endless demand).
- Skipping the check that the stationary point is a maximum.
- Data with no source, or no explanation of how it was collected.
- A best price quoted to the cent when the data supports the nearest dollar.
More Maths IA ideas in Banking, markets and economics
- Measuring inequality: Lorenz curves and the Gini coefficientFree with an account
Two countries can have the same average income and very different lives. The Gini coefficient squeezes that gap into one number. You're going to see where the number comes from, and what it hides.
- How much should you bet or invest? The Kelly criterionIn the Photon IA Guide
You have a bet where you win more often than you lose. How much of your money should you put on it? Too little wastes the edge, and too much can ruin you even though the odds are in your favour.
- How do banks create money? The money multiplierFree with an account
Someone deposits 1,000. The bank lends most of it out, and that loan is deposited at another bank, which lends again. You're going to find how far this chain can go, and whether banks really work that way.
- Budget allocation: how does the best plan change?In the Photon IA Guide
Same budget, several ways to spend it. The best plan sits on a corner, and a small price rise can send it to another corner. Your job is to see it coming.
- Two shares or one? Diversification and portfolio riskIn the Photon IA Guide
Mix a risky share with a calm one and the mixture can be safer than either. You're going to find the exact mix with the least risk, and see what decides how much you gain.
- Who gets a loan? Logistic models for credit scoringIn the Photon IA Guide
A bank cannot know who will repay. It can only estimate a probability of default and choose where to draw the line. You're going to build that estimate, find the best line, and ask who it shuts out.
- Pricing an option: from coin flips to Black-ScholesIn the Photon IA Guide
An option is a bet on a share price, and yet its fair price does not depend on how likely you think the price is to rise. You're going to find out why that is true, and build the price from coin flips.
Other free Maths IA ideas
- The rule of 72: how good is it, and why 72?
- The birthday problem: how safe are hash codes?
- Walk every bridge once: from Königsberg to your city
- Where should a screen be mounted? The best viewing angle
- How old is it? Radiocarbon dating and its errors
- Simpson's paradox: when the overall trend lies
- From rally to match: how small edges become big wins
- Day length: how does latitude change the year?
- Bouncing ball: how far does it travel in total?
- Drawing a shape with functions: how close can you get?
- Newton's method: how fast, and when does it fail?