




IB Maths IA idea · Science, nature and society
Bouncing ball: how far does it travel in total?
A ball bounces for ever in the maths and stops in your hands. You're going to measure the gap between those two stories.
These ideas are starting points, not an IA to copy. Never copy an idea blindly: make the question, method and analysis your own, and check your plan with your teacher.
The big idea
Each bounce reaches a fixed fraction r of the one before. That makes the heights a geometric sequence and the total distance a geometric series, which converges when r is below 1. Measure the peak heights, fit = , and test whether r really is constant. Then predict the total distance and compare it with a measured one. It is a gentle topic, but the series needs justifying, not quoting: why does it converge, and does the model hold on every bounce? At HL, prove the formula by induction and take on a harder series such as total time or energy.
The maths you will use
- Geometric sequences. Model the peak heights as and test the constant ratio from for every bounce.
- Infinite geometric series. Sum the distance (4.0 times for ) and say why it converges.
- Logarithms and linearising. Take , plot a straight line and read from the gradient with an uncertainty.
- Square-root series. Use that a fall of height takes to build a second series with ratio and sum the total time.
- Proof by induction. Prove the formula for the partial sum by induction, then take the limit as (HL).
Key equations
The maths in action
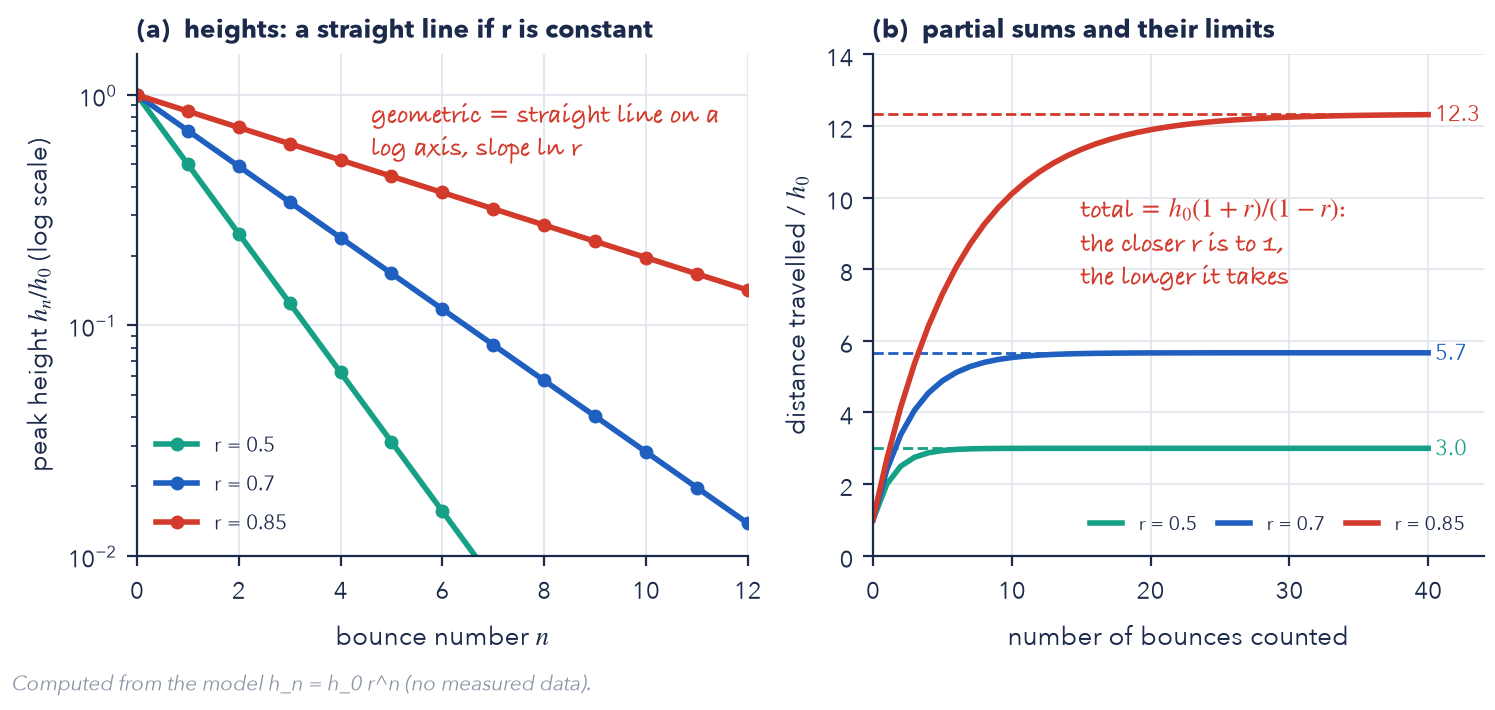
Example research question
How well does a constant-ratio model of bounce heights predict the total distance and the total time a ball travels, for a tennis ball dropped from 1.0 m onto two surfaces, and how does the restitution ratio relate to the energy lost per bounce?
Change the context, the data or the method so the question is yours. Our Maths IA guide shows how to check it.
Check your research question
- Names the ball, the surface and the drop height (or heights).
- Says how heights will be measured and to what resolution.
- Names the model being tested (geometric) and the prediction being checked: total distance, total time, or bounces to a given height.
- Says what the prediction is compared with.
- Is narrow: at least 6 bounces recorded, with repeated drops.
Which course it fits
- AA SL ideal
- AA HL ideal
- AI SL ideal
- AI HL ideal
Syllabus links in Maths AA:
- AA 1.3 Geometric sequences and series
- AA 1.5 Exponents and an introduction to logarithms
- AA 1.8 Infinite geometric series
- AA 2.9 Exponential and logarithmic functions
- AA 1.15 Proof by induction, contradiction and counterexample (HL only)
Steps
- Read and predict. Learn the geometric sequence and series. Sketch what the heights should do, and guess r with a reason.
- Trial run (1 lesson). Drop and film one ball. Can you read each peak? Does the ball stay in the frame? Is the ruler visible and square-on?
- Plan the experiment. Choose balls, surfaces, drop heights and repeats. Write down why for each.
- Collect the data. Record peak heights for at least 6 bounces per drop, with resolution noted.
- Test constant r. Plot each height against the one before it. Does the ratio stay put, or drift?
- Fit the model. Fit = and find r with an uncertainty. Compare the two methods.
- Predict the distance. Build the distance as a series (up and down), sum it, and measure the total for comparison.
- Go further. SL: a second surface or ball. HL: prove the formula and treat time or energy with a harder series.
- Write, then cut. Write in layout order. Show one worked sum, then a table; put long data in an appendix.
- Check before your teacher's draft. Check each symbol is defined, graphs have titled axes with units, and reflection runs through the piece.
Make it yours
- Compare surfaces. Floor, carpet, grass, a gym mat.
- Compare balls. Tennis, basketball, squash, a bouncy ball.
- Test the constant ratio. Plot each height against the previous one and look for a line through the origin.
- Predict the time. Time between bounces depends on the square root of the height, giving a second series.
- Bring in energy. Link r to the energy lost per bounce.
- Film it. Compare reading peaks by eye with a frame-by-frame method.
HL extension
Prove the partial-sum formula by induction, derive the total time from a second series with ratio , link to the coefficient of restitution by , and test whether is really constant by plotting against .
The data you need
Drop a ball from a measured height and read the peak of each bounce from slow-motion video against a ruler, for several surfaces or balls; repeat each drop at least three times.
Traps
- Quoting the infinite sum formula without saying why the series converges.
- Forgetting the ball goes up and down: after the first drop each bounce counts twice.
- Reading peaks to the nearest 5 cm, then trusting heights of 3 cm.
- Fitting an exponential in software without testing whether the ratio is constant.
- Assuming the ball stops exactly when the formula says: the model has a practical end.
- Mixing bounce number and time on the same axis.
More Maths IA ideas in Science, nature and society
- The Keeling curve: modelling carbon dioxideIn the Photon IA Guide
Since 1958 one mountain in Hawaii has recorded the carbon dioxide in the air, and the graph has a zigzag on top of a climb. Which function describes the climb, and what year does each model say we hit 450 ppm?
- Is Moore's law over? Fitting exponential growthFree with an account
Every two years or so, the number of transistors on a chip is said to double. That is a claim you can test with a ruler and a log scale, and you can look for the point where it stops being true.
- Population: exponential or logistic for one country?Free with an account
Any spreadsheet will draw a curve through population data. The real question is which model deserves to, and what happens when you use it to predict.
- Will the population keep ageing? Leslie matricesIn the Photon IA Guide
Some countries have fewer than one birth per woman. Nothing dramatic happens in year one, but a matrix can show you what the age structure looks like in fifty years, and why it cannot be fixed quickly.
Other free Maths IA ideas
- The rule of 72: how good is it, and why 72?
- Setting a price: how to maximise profit from real data
- The birthday problem: how safe are hash codes?
- Walk every bridge once: from Königsberg to your city
- Where should a screen be mounted? The best viewing angle
- How old is it? Radiocarbon dating and its errors
- Simpson's paradox: when the overall trend lies
- From rally to match: how small edges become big wins
- Day length: how does latitude change the year?
- Drawing a shape with functions: how close can you get?
- Newton's method: how fast, and when does it fail?