Free worked solutions · 2026 Edition

IB Maths AI HL Chapter 7: Modelling with functions and regression worked solutions

Worked solutions to the practice questions in Chapter 7 of Photon Guidebook: Mathematics Applications and Interpretation HL for the IB Diploma (2026 Edition). Each solution shows every step with the mark it earns, the way an IB mark scheme does.

  • Chapter 7 of 24
  • Volume 1
  • 26 practice questions
  • 2 Going further
  • Free, no sign-up

Basics

One idea at a time, in the order the chapter teaches them.

Question 1

[4 marks]
A refill service uses C(n)=an+b. It charges 23 dollars for 2 bottles and 41 dollars for 5 bottles.
Find a,b and interpret the fixed charge.
[4]
Show solutionHide solution
2a+b=23, 5a+b=41.
M1
Subtracting gives a=6.
A1
b=11, so C(n)=6n+11.
A1
The fixed charge is 11 dollars even before any per-bottle charge.
R1

Final answer

a=6, b=11; the fixed charge is 11 dollars.

Question 2

[4 marks]
Illumination L is modelled by L=k/d^2, where d>0 is distance in metres. At d=3, L=44 units.
Find k and predict L at d=6. Explain the change.
[4]
Show solutionHide solution
k=44(3)^2=396. M1A1
L(6)=396/36=11 units.
A1
Doubling distance multiplies its square by 4, so the output is quartered.
R1

Final answer

k=396; L=11 units at d=6 (quartered).

Question 3

[4 marks]
A calibration model is Q(x)=ax^2+bx+c. Measurements are Q(0)=7, Q(1)=10, Q(3)=28.
Form the equations and use technology to find the three coefficients.
[4]
Show solutionHide solution
c=7.
A1
a+b+c=10, 9a+3b+c=28.
M1
The simultaneous solver gives a=2, b=1. A1A1
The rule is Q(x)=2x^2+x+7.

Final answer

a=2, b=1, c=7.

Question 4

[4 marks]
A response curve is R(x)=a(x-4)^2+9. The model has its minimum value 9 at input 4, and R(1)=27.
Find a, predict R(6) and explain why this rule has a minimum.
[4]
Show solutionHide solution
27=9a+9.
M1
a=2.
A1
R(6)=2(2)^2+9=17.
A1
a>0 and the square is non-negative, so the least possible output is 9.
R1

Final answer

a=2; R(6)=17; a minimum because a>0.

Question 5

[4 marks]
The temperature of a test enclosure is modelled by T(t)=Ae^{kt}+17.3. It is 53.3 degrees Celsius at t=0 and 29.3 degrees Celsius at t=7 minutes.
Find A and k to 3 significant figures. State the long-term temperature predicted by this model.
[4]
Show solutionHide solution
A+17.3=53.3, so A=36.0.
A1
Solve 36e^{7k}+17.3=29.3 numerically.
M1
k=-0.156945\ldots\approx-0.157.
A1
The exponential term approaches zero, so the predicted temperature approaches 17.3 degrees Celsius.
A1

Final answer

A=36.0, k=-0.157; long term 17.3\,{}^{\circ}C.

Question 6

[4 marks]
A repeating lighting intensity is modelled by I(t)=a\sin(bt)+d, with angles in degrees. Its maximum is 84, minimum 28 and period 18 seconds. Assume a,b>0. Amplitude is half the difference of maximum and minimum; d is their midpoint; b=360/\text{period}.
Find a,b,d and predict I(0).
[4]
Show solutionHide solution
a=(84-28)/2=28.
A1
b=360/18=20.
A1
d=(84+28)/2=56.
A1
I(0)=56.
A1

Final answer

a=28, b=20, d=56; I(0)=56.

Question 7

[3 marks]
A piecewise function selects a formula using the input interval. A storage charge, in dollars, for t hours is C(t)=\begin{cases}3.7t,&0\le t\le2.5,\\9.25+1.4(t-2.5),&t>2.5.\end{cases}
Calculate C(2.5) and C(2.8). State which branch applies at t=2.5.
[3]
Show solutionHide solution
The first branch includes 2.5, so C(2.5)=3.7(2.5)=9.25 dollars. A1 At 2.8, use the second branch: C(2.8)=9.25+1.4(0.3)=9.67 dollars. A1 The boundary uses the first formula because its interval contains equality.
R1

Final answer

C(2.5)=9.25, C(2.8)=9.67 dollars; the first branch applies at 2.5.

Question 8

[3 marks]
A response model is P(t)=\dfrac{900}{1+8e^{-kt}}, with k>0. A measurement gives P(4)=300.
Find k and check the stated measurement using your unrounded parameter.
[3]
Show solutionHide solution
900/(1+8e^{-4k})=300 gives 8e^{-4k}=2. M1 Therefore k=\ln4/4=0.347 to three significant figures. A1 Using exact k=\ln4/4 makes the denominator 1+8(1/4)=3, so P(4)=300.
A1

Final answer

k=\frac{\ln 4}{4}=0.347.

Question 9

[3 marks]
A log-log plot uses X=\ln x and Y=\ln y for x,y>0. A power model y=ax^n becomes Y=nX+\ln a. A line on these axes is Y=2.7X-0.6.
Write the power model with an exact coefficient, and find the factor by which y changes when x is doubled.
[3]
Show solutionHide solution
The model is y=e^{-0.6}x^{2.7}. A1 Doubling x multiplies y by 2^{2.7}=6.50 to three significant figures.
M1A1

Final answer

y=e^{-0.6}x^{2.7} (0.549x^{2.7}); doubling x multiplies y by 6.50.

Question 10

[3 marks]
Three observations are 9.3,12.8,15.1, and their corresponding predictions are 9.8,12.2,15.4.
Calculate all residuals and SS_{\rm res}.
[3]
Show solutionHide solution
Residuals are -0.5,0.6,-0.3. A1 SS_{\rm res}=(-0.5)^2+0.6^2+(-0.3)^2=0.70.
M1A1

Final answer

Residuals −0.5, 0.6, −0.3; SS_{\mathrm{res}}=0.70.

Tutorial

Exam-style questions on each question type, with the marks the IB would give.

Question 11

[7 marks]
Priya is designing a footbridge whose arch is modelled by h = ax^2+bx+c, where h metres is the height of the arch above the water at a horizontal distance of x metres from the left support. Surveyors measure three points on the arch:
\begin{array}{c|ccc} x \text{(m)} & \text{0} & \text{4} & \text{10} \\ \hline h \text{(m)} & \text{2.0} & \text{4.4} & \text{5.0} \\ \end{array}
(a) Find the values of a, b and c.
[3]
(b) Find the maximum height of the arch above the water and the value of x at which it occurs.
[2]
(c) The right-hand support is at the same height above the water as the left-hand support. Find the horizontal distance between the two supports.
[2]
Show solutionHide solution
(a) x=0: c = 2.
[1]
16a + 4b + 2 = 4.4 and 100a+10b+2 = 5. Solve simultaneously on the GDC (or by hand).
[1]
a = -0.05, b = 0.8 (so h = -0.05x^2+0.8x+2).
[1]
(b) Vertex at x = -\dfrac{0.8}{2(-0.05)} = 8 m.
[1]
h(8) = -0.05(64)+0.8(8)+2 = 5.2 m.
[1]
(c) The parabola is symmetric about x=8, and the left support is at x=0 (an 8 m distance from the axis).
[1]
The right support is at x = 16 m, so the distance between the supports is 16 m.
[1]

Final answer

a=-0.05, b=0.8, c=2; maximum 5.2 m at x=8; supports 16 m apart.

Question 12

[7 marks]
The organisers of a cycling event model the altitude of the first 30 km of the route by a cubic y = ax^3+bx^2+cx+d, where y metres is the altitude above sea level at a distance of x kilometres from the start. Four altitudes are taken from the route map:
\begin{array}{c|cccc} x \text{(km)} & \text{0} & \text{10} & \text{20} & \text{30} \\ \hline y \text{(m)} & \text{300} & \text{330} & \text{300} & \text{330} \\ \end{array}
(a) Use your GDC to find the values of a, b, c and d.
[3]
(b) The route has a lowest point between x=10 and x=30. Find the coordinates of this lowest point.
[2]
(c) The organisers claim that the route never drops below the altitude of the start line. State whether the model supports this claim, giving a reason.
[2]
Show solutionHide solution
(a) Four equations: d=300; 1000a + 100b + 10c + 300 = 330; 8000a + 400b+20c+300=300; 27000a+900b+30c+300=330.
[1]
Solve on the GDC (simultaneous equations, or cubic regression through the four points).
[1]
a = 0.02, b = -0.9, c = 10, d = 300.
[1]
(b) Graph y = 0.02x^3 - 0.9x^2 + 10x + 300 and use the minimum function on 10<x<30.
[1]
Lowest point (22.6,\ 297.2).
[1]
(c) The lowest altitude is about 297.2 m, which is less than the start altitude of 300 m.
[1]
So the model does not support the claim (the route dips about 2.8 m below the start altitude).
[1]

Final answer

a=0.02, b=-0.9, c=10, d=300; lowest point (22.6,\,297); the claim is not supported.

Question 13

[8 marks]
A 3D-printing studio prints solid scale models of one design. The mass M grams of filament used for a model of height h cm is modelled by M = a\,h^{n}. A model of height 4 cm uses 25.6 g and a model of height 7 cm uses 137.2 g.
(a) Find the value of n.
[3]
(b) Find the value of a.
[1]
(c) Give a geometric reason why the value of n is reasonable for solid models of the same shape.
[1]
(d) Find the mass of a model of height 10 cm.
[1]
(e) The studio has 500 g of filament left. Find the height of the tallest model it can print.
[2]
Show solutionHide solution
(a) Dividing the two equations: \dfrac{137.2}{25.6} = \left(\dfrac{7}{4}\right)^{n}.
[1]
n = \dfrac{\ln(137.2/25.6)}{\ln(7/4)}.
[1]
n = 3.
[1]
(b) a = \dfrac{25.6}{4^3} = 0.4.
[1]
(c) The mass of a solid is proportional to its volume, and volume scales with the cube of a linear dimension such as the height.
[1]
(d) M = 0.4(10)^3 = 400 g.
[1]
(e) 0.4h^3 = 500 \Rightarrow h^3 = 1250.
[1]
h = 10.8 cm.
[1]

Final answer

n=3, a=0.4; 400 g; 10.8 cm.

Question 14

[8 marks]
Sipho is a trainee pastry chef. The number S of cupcakes he can decorate per hour after t weeks of training is modelled by S = a + b\ln t, for t\ge1. After 2 weeks he decorates 40 cupcakes per hour and after 10 weeks he decorates 70 cupcakes per hour.
(a) Find the values of a and b.
[3]
(b) Find how many weeks of training are needed to reach 85 cupcakes per hour.
[2]
(c) Show that, according to the model, the increase in his hourly output over any period in which the training time doubles is the same constant, and find its value.
[3]
Show solutionHide solution
(a) a + b\ln 2 = 40 and a + b\ln 10 = 70.
[1]
Subtracting: b(\ln 10 - \ln 2) = 30, so b = \dfrac{30}{\ln 5} = 18.6.
[1]
a = 40 - 18.6\ln 2 = 27.1.
[1]
(b) 27.1 + 18.6\ln t = 85.
[1]
t = 22.4 weeks, so 23 whole weeks of training are needed.
[1]
(c) S(2t)-S(t) = b\ln(2t) - b\ln t.
[1]
= b(\ln 2 + \ln t - \ln t) = b\ln 2 (independent of t).
[1]
b\ln 2 = 18.6\times 0.6931 = 12.9 cupcakes per hour.
[1]

Final answer

b=18.6, a=27.1; 22.4 weeks, so 23 whole weeks; b\ln2=12.9.

Question 15

[8 marks]
The membership M of an online chess club is modelled by M = \dfrac{L}{1+Ce^{-kt}}, where t is the number of months since the club began. The club's software licence limits the membership to a maximum of 2000. There were 50 members at the start, and 500 members after 4 months.
(a) Write down the value of L and show that C = 39.
[2]
(b) Find the exact value of k, and its value to 3 significant figures.
[3]
(c) Find the time at which the membership first exceeds 1800.
[2]
(d) Show that the model can never predict a membership above the licence limit.
[1]
Show solutionHide solution
(a) L = 2000.
[1]
M(0) = \dfrac{2000}{1+C} = 50 \Rightarrow 1 + C = 40.
[1]
So C = 39.
AG
(b) \dfrac{2000}{1+39e^{-4k}} = 500 \Rightarrow 1 + 39e^{-4k} = 4.
[1]
e^{-4k} = \dfrac{1}{13}, so k = \dfrac{\ln 13}{4}.
[1]
k = 0.641.
[1]
(c) \dfrac{2000}{1+39e^{-kt}} > 1800 \Rightarrow 1+39e^{-kt} < \dfrac{10}{9}.
[1]
t > \dfrac{1}{k}\ln 351 = 9.14 months.
[1]
(d) Ce^{-kt} > 0 for all t, so the denominator exceeds 1 and M < 2000 always.
[1]

Final answer

L=2000, C=39; k=\frac{\ln13}{4}=0.641; 9.14 months.

Question 16

[8 marks]
Marisol sells a seasonal drink. After a promotion ends, the weekly number y of cups sold (in tens) in week t is
\begin{array}{c|cccccc} t & \text{1} & \text{2} & \text{3} & \text{4} & \text{5} & \text{6} \\ \hline y & \text{62} & \text{49} & \text{38} & \text{29} & \text{24} & \text{19} \\ \end{array}
She proposes two models: model A, y = 1.14t^2 - 16.5t + 77.4, and model B, y = 78.0(0.788)^{t}.
(a) Calculate SS_{\text{res}} = \sum (y-\hat y)^2 for model A.
[2]
(b) Calculate SS_{\text{res}} for model B.
[2]
(c) State which model fits the six data points better.
[1]
(d) Marisol wants to forecast sales for week 14. Find the prediction from each model and comment on its validity.
[2]
(e) Recommend which model she should use for forecasting, giving a reason.
[1]
Show solutionHide solution
(a) Fitted values for A: 62.0, 49.0, 38.2, 29.6, 23.4, 19.4.
[1]
SS_{\text{res}}(A) = 0.992.
[1]
(b) Fitted values for B: 61.5, 48.4, 38.2, 30.1, 23.7, 18.7.
[1]
SS_{\text{res}}(B) = 1.99.
[1]
(c) Model A fits the data better, since its SS_{\text{res}} is smaller.
[1]
(d) Model A: y(14) = 69.8 tens of cups, i.e. sales that rise sharply: the parabola has its minimum at t = 7.24 and then climbs.
[1]
Model B: y(14) = 2.78, i.e. about 28 cups: sales that keep falling towards zero, which is sensible after a promotion ends.
[1]
(e) Model B: although A fits slightly closer on weeks 1 to 6, A predicts a rebound in sales that has no cause in the context; B has the right long-term shape.
[1]

Final answer

SS_{\mathrm{res}}: A 0.992, B 1.99; A fits better; week 14: A 69.8, B 2.78; use B.

Question 17

[8 marks]
The drag force F (newtons) on a cyclist at speed v (metres per second) is measured in a wind-tunnel test.
\begin{array}{c|cccccc} v \text{(m/s)} & \text{2} & \text{4} & \text{6} & \text{8} & \text{10} & \text{12} \\ \hline F \text{(N)} & \text{3.9} & \text{15.7} & \text{36.1} & \text{64.4} & \text{99.0} & \text{145.0} \\ \end{array}
(a) Calculate \ln v and \ln F for each of the six measurements, giving 3 significant figures.
[2]
(b) Find the equation of the regression line of \ln F on \ln v.
[2]
(c) Hence find a model of the form F = a\,v^{n}.
[2]
(d) Physics predicts that the drag force is proportional to v^{2}. State whether the data supports this, giving a reason.
[1]
(e) Use the model to find the drag force at v=15.
[1]
Show solutionHide solution
(a) \ln v: 0.693, 1.39, 1.79, 2.08, 2.30, 2.48.
[1]
\ln F: 1.36, 2.75, 3.59, 4.17, 4.60, 4.98.
[1]
(b) Linear regression of \ln F (List 2) on \ln v (List 1):
[1]
\ln F = 2.02\ln v - 0.0364.
[1]
(c) n = 2.02 (the gradient), a = e^{-0.0364} = 0.964.
[1]
F = 0.964\,v^{2.02}.
[1]
(d) Yes: n = 2.02 \approx 2 (rounds to 2.02), so F\propto v^{2} approximately.
[1]
(e) F(15) = 0.964(15)^{2.02} = 227 N.
[1]

Final answer

\ln F=2.02\ln v-0.0364; F=0.964v^{2.02}; supports v^2; 227 N.

Question 18

[9 marks]
A fairground wheel has a diameter of 36 m and its lowest point is 2.5 m above the ground. One complete turn takes 80 seconds. The height h metres of a rider, t seconds after boarding at the lowest point, is modelled by h=20.5-18\cos(4.5t), where the angle is in degrees.
(a) Find the height of the rider after 50 seconds.
[2]
(b) Find the first time at which the rider is 30 m above the ground.
[2]
(c) Find the length of time in each turn for which the rider is more than 30 m above the ground.
[3]
(d) Express your answer to (c) as a percentage of the time for one turn.
[2]
Show solutionHide solution
(a) h(50)=20.5-18\cos(225^{\circ}) (degree mode).
[1]
=20.5-18(-0.7071\ldots)=33.2 m.
[1]
(b) Solve 20.5-18\cos(4.5t)=30 on the GDC: graph y=20.5-18\cos(4.5t) and y=30 and take the first intersection.
[1]
\cos(4.5t)=-\dfrac{9.5}{18}=-0.5278, so 4.5t=121.85^{\circ} and t=27.1 s.
[1]
(c) The graph is above 30 between the first intersection and the second, which by the symmetry of the cosine graph is at t=80-27.08=52.92.
[1]
Time above 30 m =52.921-27.079 [1] =25.8 s.
[1]
(d) \dfrac{25.84}{80}\times100 [1] =32.3\% of each turn.
[1]

Final answer

33.2 m; 27.1 s; 25.8 s; 32.3%.

Question 19

[10 marks]
Dara records the air temperature T\,{}^{\circ}C in her garden shed every 3 hours, starting at midnight (t=0).
\begin{array}{l|ccccccccc} t \text{(hours)} & 0 & 3 & 6 & 9 & 12 & 15 & 18 & 21 & 24 \\ \hline T \text{(} ^{\circ} \text{C)} & 11.6 & 9.4 & 11.0 & 17.3 & 22.4 & 25.2 & 22.9 & 17.0 & 11.2 \\ \end{array}
She decides to model the temperature by T=a\sin(b(t-c))+d with a>0, c>0 and the angle in radians.
(a) Use the greatest and least values in the table to estimate a and d.
[2]
(b) Dara expects the pattern to repeat every day. Find the value of b.
[2]
(c) The greatest temperature in the table occurs at t=15. Use this to find the smallest positive value of c.
[3]
(d) Use your model to find the temperature predicted at t=12, and find the difference from the recorded value.
[2]
(e) State one reason why the model cannot match a real day's temperatures exactly.
[1]
Show solutionHide solution
(a) Greatest =25.2, least =9.4: a=\dfrac{25.2-9.4}{2}=7.9 [1] d=\dfrac{25.2+9.4}{2}=17.3
[1]
(b) Period =24 hours, so b=\dfrac{2\pi}{24}.
[1]
b=\dfrac{\pi}{12}=0.262.
[1]
(c) The sine model is greatest when its bracket equals \dfrac{\pi}{2} at t=15: \dfrac{\pi}{12}(15-c)=\dfrac{\pi}{2}.
[1]
15-c=6.
[1]
c=9.
[1]
(d) T(12)=7.9\sin\!\left(\dfrac{\pi}{12}(12-9)\right)+17.3=7.9\sin\!\left(\dfrac{\pi}{4}\right)+17.3=22.9\,{}^{\circ}C.
[1]
The recorded value is 22.4\,{}^{\circ}C, so the model is 0.5\,{}^{\circ}C too high (to 1 d.p.).
[1]
(e) Real temperatures are affected by weather (cloud, wind, rain), so they do not follow a perfect repeating wave from day to day.
[1]

Final answer

a=7.9, d=17.3; b=\frac{\pi}{12}=0.262; c=9; 22.9\,{}^{\circ}C, 0.5\,{}^{\circ}C too high.

Question 20

[8 marks]
Lena, an ecologist, models the water temperature, W\,{}^{\circ}C, of a lake t months after the start of April by W=a\sin(bt)+c, where the period of the model is 12 months. She records 19.8\,{}^{\circ}C at t=3 and 11.1\,{}^{\circ}C at t=7.
(a) Find the value of b.
[1]
(b) Write down two equations in a and c.
[2]
(c) Find the values of a and c.
[2]
(d) A reading of 16.5\,{}^{\circ}C was taken at t=1. Determine whether this reading lies above or below the graph of the model.
[2]
(e) Write down the greatest temperature predicted by the model.
[1]
Show solutionHide solution
(a) b=\dfrac{360}{12}=30.
[1]
(b) \sin 90^{\circ}=1 gives a+c=19.8; \sin 210^{\circ}=-0.5 gives -0.5a+c=11.1.
[2]
(c) Subtracting, 1.5a=8.7, so a=5.8 and c=14.0.
[2]
(d) W(1)=5.8\sin 30^{\circ}+14=16.9; since 16.5<16.9 the reading lies below the graph.
[2]
(e) a+c=19.8\,{}^{\circ}C.
[1]

Final answer

(a) b=30. (b) a+c=19.8 and -0.5a+c=11.1. (c) a=5.8, c=14.0. (d) W(1)=16.9, so the reading is below the graph. (e) 19.8\,{}^{\circ}C.

Mastery

Full exam questions that mix question types, at Paper 1 and Paper 2 standard.

Question 21

[12 marks]
A materials scientist studies the fatigue strength y (in MPa) of a metal beam under repeated stress cycles. She measures y at various numbers of cycles x (in thousands).
x (thousand cycles)123456
y (MPa)4.011.320.832.044.758.8
(a) Using your GDC, find and state R^{2} for each of the following models:
(i) a linear model y = mx + c;
(ii) a power model y = a\,x^{b}.
[5]
(b) State which model you would choose, giving a reason.
[2]
(c) For your chosen model, write down its equation with parameters to 3 significant figures.
[1]
(d) (i) Use your chosen model to estimate y when x = 8 (thousand cycles).
(ii) Comment on the reliability of this estimate.
[4]
Show solutionHide solution
(a)(i) Linear regression: y = 11.0x - 9.94 with R^{2} = 0.988 (approx).
(ii) Power regression: y = 4.00\,x^{1.50} with R^{2} = 1.00 (to 3 s.f.).
[5]
(b) Choose the power model, because its R^{2} is closer to 1, so it fits the data more closely.
[2]
(c) y = 4.00\,x^{1.50}.
[1]
(d)(i) y = 4.00(8)^{1.50} = 4.00 \times 22.6 = 90.5 MPa (3 s.f.).
(ii) x = 8 lies just beyond the data range (1 to 6), so this is an extrapolation and is somewhat less reliable, though x=8 is close to the data so the estimate is reasonable.
[4]

Final answer

y=11.0x-9.94, R^2=0.988; y=4.00x^{1.50}, R^2=1.00; power model; y(8)=90.5 MPa, an extrapolation.

Question 22

[13 marks]
In a northern town the number of hours of daylight is modelled by
L(n)=12.1+3.7\sin\!\left(\frac{2\pi}{365}(n-81)\right)
where n is the day number (n=1 is 1 January).
(a) Find the number of daylight hours predicted on
(i) 1 January (n=1);
(ii) the summer solstice, day n=172.
[4]
(b) Find the amplitude of L and interpret it in this context.
[2]
(c) Explain the significance of the value 81 appearing in the model.
[2]
(d) Using your GDC, find the number of days in the year on which the town has more than 14 hours of daylight.
[5]
Show solutionHide solution
(a)(i) L(1)=12.1+3.7\sin\!\left(\dfrac{2\pi}{365}(1-81)\right)\approx12.1+3.7(-0.981)\approx8.47 hours.
(ii) L(172)=12.1+3.7\sin\!\left(\dfrac{2\pi}{365}(172-81)\right)\approx12.1+3.7(0.99999)\approx15.80 hours.
[4]
(b) Amplitude =3.7; the daylight length varies 3.7 hours above and below the average of 12.1 hours through the year.
[2]
(c) When n=81 the sine term is zero, so daylight equals the midline 12.1 h; n=81 (around 22 March) is when day length crosses its average while increasing, i.e. the spring equinox.
[2]
(d) Solving L(n)=14: \sin\!\left(\dfrac{2\pi}{365}(n-81)\right)=\dfrac{1.9}{3.7}\approx0.514, giving n\approx112.3 and n\approx232.2. Daylight exceeds 14 h for whole days n=113 to n=232, i.e. 232-113+1=120 days.
[5]

Final answer

8.47 h; 15.8 h; amplitude 3.7 h; day 81 is the equinox; 120 days.

Question 23

[12 marks]
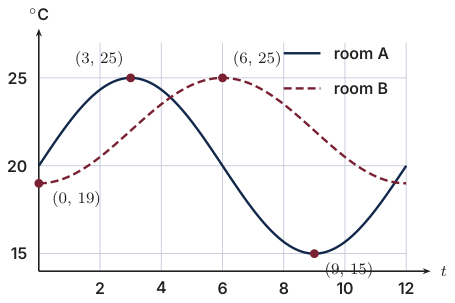
Two server rooms, A and B, in a data centre have temperatures, in degrees Celsius, modelled by T_A=a\sin(bt)+d and T_B=p-q\cos(bt), where t is the number of hours after 08:00 and the angles are in degrees. The graph shows both models for 0\le t\le 12; the marked points are the maximum and minimum of room A and the minimum and maximum of room B.
Original Photon diagram
(a) Find the values of a, b and d for room A.
[3]
(b) Find the values of p and q for room B.
[2]
(c) Use your GDC to find the times at which the two rooms have the same temperature.
[2]
(d) Find the greatest value of |T_A-T_B| during the 12 hours, and the time at which it occurs.
[3]
(e) Maintenance is called when the temperatures differ by more than 6\,{}^{\circ}C. Explain whether maintenance is called during the 12 hours.
[2]
Show solutionHide solution
(a) Room A has maximum 25 at t=3 and minimum 15 at t=9: d=\dfrac{25+15}{2}=20 and a=\dfrac{25-15}{2}=5.
[1]
Max to min is half a period (9-3=6), so the period is 12 hours.
[1]
b=\dfrac{360}{12}=30, so T_A=5\sin(30t)+20.
[1]
(b) Room B has minimum 19 and maximum 25: p=\dfrac{25+19}{2}=22 [1] and q=\dfrac{25-19}{2}=3 [1] (its minimum is at t=0, so -\cos with the same b=30).
(c) Graph y=5\sin(30t)+20 and y=22-3\cos(30t) in degree mode and use Intersection.
[1]
t=4.30 and t=11.6 hours.
[1]
(d) Graph y=T_A-T_B=5\sin(30t)+3\cos(30t)-2 for 0\le t\le12 and find its maximum and minimum.
[1]
The maximum is +3.83 (at t=1.97) and the minimum is −7.83 (at t=7.97), so the greatest value of |T_A-T_B| is 7.83\,{}^{\circ}C [1] at t=7.97 hours.
[1]
(e) Since 7.83>6, the temperatures differ by more than 6\,{}^{\circ}C at some time, so maintenance is called.
[1]
This happens around t\approx8 (about 16{:}00), when room B is about 7.8\,{}^{\circ}C hotter than room A.
[1]

Final answer

a=5, b=30, d=20; p=22, q=3; t=4.30, 11.6; greatest 7.83\,{}^{\circ}C at t=7.97; maintenance is called.
Question 24

[12 marks]
A car ferry crosses a river estuary from a ramp at Seal Point. High water, of depth 5.9 m at the ramp, occurs at 02:00 and the following low water, of depth 2.3 m, occurs at 08:00. The depth of water at the ramp, D metres, t hours after 02:00 is modelled by D=a\cos(bt)+d.
(a) Find the values of a, b and d.
[3]
(b) Find the depth of water at the ramp at 06:30.
[1]
The ferry can only use the ramp when the depth is more than 3.2 m. The actual depth may differ from the model by up to 0.2 m above or below.
(c) Find the latest time after 02:00, before the low water, at which it could still be possible for the ferry to use the ramp. Give your answer to the nearest minute.
[3]
(d) Find the earliest time after the low water at which the ferry is certain to be able to use the ramp.
[3]
(e) The ferry leaves the ramp at the time found in (d). Each crossing takes 35 minutes. Find the greatest length of time the ferry can spend at the far side and still be certain of using the ramp when it returns the same day.
[2]
Show solutionHide solution
(a) a=\dfrac{5.9-2.3}{2}=1.8 and d=\dfrac{5.9+2.3}{2}=4.1; the period is 12 hours, so b=30.
[3]
(b) D(4.5)=1.8\cos135^{\circ}+4.1=2.83 m.
[1]
(c) It is possible when D>3.0: t=4.2557, which is 06:15.
[3]
(d) It is certain when D>3.4: t=8.2372, which is 10:14.
[3]
(e) The certain window closes at t=15.763 (17:46). 15.763-8.237-\dfrac{70}{60}=6.36 hours.
[2]

Final answer

a=1.8, b=30, d=4.1; 2.83 m; 06:15; 10:14; 6.36 h.

Question 25

[8 marks]
A water company fills a reservoir using n identical pumps. It models the time taken, T hours, by T=\dfrac{k}{n}. Three trials give the results below.
\begin{array}{c|ccc} n & 1 & 2 & 4 \\ \hline T & 23.6 & 12.3 & 5.8 \end{array}
(a) Show that the sum of square residuals is SS_{\mathrm{res}}=1.3125k^2-62.4k+c, and find the exact value of c.
[3]
(b) Find the value of k that gives the least-squares model.
[2]
(c) Find the least possible value of SS_{\mathrm{res}}.
[1]
(d) Use the least-squares model to estimate the time taken by 3 pumps.
[1]
(e) Explain why the model cannot be used for n=0.
[1]
Show solutionHide solution
(a) (k-23.6)^2+\left(\dfrac k2-12.3\right)^2+\left(\dfrac k4-5.8\right)^2=\left(1+\dfrac14+\dfrac1{16}\right)k^2-2(23.6+6.15+1.45)k+c, so the coefficients are 1.3125 and −62.4; c=23.6^2+12.3^2+5.8^2=741.89.
[3]
(b) k=\dfrac{62.4}{2(1.3125)}=23.8 (23.771).
[2]
(c) SS_{\mathrm{res}}=0.221.
[1]
(d) \dfrac{23.771}{3}=7.92 hours.
[1]
(e) k/0 is undefined: with no pumps the reservoir never fills.
[1]

Final answer

c=741.89; k=23.8; SS_{\mathrm{res}}=0.221; 7.92 h; n=0 is undefined.

Question 26

[18 marks]
A town has 6000 homes. The number of homes with solar panels, H hundred, t years after the start of 2016 is shown in the table.
\begin{array}{c|ccccccc} t & 0 & 1 & 2 & 3 & 4 & 5 & 6 \\ \hline H & 2.1 & 3.0 & 4.4 & 6.1 & 8.3 & 11.0 & 13.9 \end{array}
(a) Use quadratic regression to find a model for H in terms of t, and write down the value of R^2.
[3]
(b) Comment on the value of R^2.
[1]
(c) Interpret the constant term of your model in context.
[1]
(d) Use the quadratic model to predict H at t=20, and explain why this prediction is impossible.
[2]
A council officer proposes the model H=\dfrac{60}{1+Ce^{-kt}}, where C and k are positive constants.
(e) Explain why 60 is a sensible value in this model. Use the values of H at t=0 and t=6 to find C and k.
[4]
(f) Find the value of t at which the logistic model predicts that 90% of homes have solar panels.
[2]
(g) Find the residual at t=3 for each model.
[2]
(h) Recommend which model the council should use to plan for 2030, giving a reason.
[2]
(i) State one limitation of the logistic model.
[1]
Show solutionHide solution
(a) H=0.208t^2+0.725t+2.09; R^2=0.99990, which is 1.00 to 3 significant figures.
[3]
(b) The curve fits the seven points almost exactly, which says nothing about later years.
[1]
(c) The model's value for 2016: about 209 homes.
[1]
(d) H(20)=99.9 hundred, more than the 60 hundred homes in the town.
[2]
(e) 60 hundred is every home in the town, the ceiling. \dfrac{60}{1+C}=2.1 gives C=27.6 (27.571); \dfrac{60}{1+Ce^{-6k}}=13.9 gives k=0.353 (0.35298).
[4]
(f) H=54: t=\dfrac{\ln 9C}{k}=15.6.
[2]
(g) Logistic: H(3)=5.68, residual 0.420. Quadratic: H(3)=6.138, residual −0.0381.
[2]
(h) The logistic model: although its residuals are larger over 2016 to 2022, it respects the 6000-home ceiling. For 2030, t=14, the quadratic predicts H=53.1 hundred and is still accelerating.
[2]
(i) For example, it assumes every home will eventually install panels, or that the growth rate k stays constant.
[1]

Final answer

H=0.208t^2+0.725t+2.09, R^2=1.00; 99.9 hundred exceeds 60 hundred; C=27.6, k=0.353; t=15.6; residuals 0.420 and −0.0381; use the logistic model.

Going further

Beyond the syllabus: the worked examples and investigations of the chapter's Going further pages.

G1 The best k for any model y=kg(x)

G1 Worked

[5 marks]
Aroha loads a spring with x=1,2,3 newtons and measures the stretch y=2.1,\,3.9,\,6.2 cm. She models the stretch by y=kx.
(a) Find \sum x^2 and \sum xy.
[2]
(b) Find the value of k that minimises SS_{\mathrm{res}}.
[2]
(c) Use the model to estimate the stretch under 2.5 N.
[1]
Show solutionHide solution
(a) \sum x^2=1+4+9=14 (A1). \sum xy=2.1+7.8+18.6=28.5 (A1). (b) k=\dfrac{28.5}{14} (M1) =2.04 cm per N, from 2.0357\ldots (A1). (c) 2.0357\times2.5=5.09 cm (A1).

Final answer

k=2.04 cm per N; 5.09 cm.

G2 A logistic curve hides a straight line

G2 Investigation

[17 marks]
A fibre broadband network is installed in a village of 500 homes. The number of homes connected, N, t months after the network opens is recorded.
\begin{array}{c|ccccccc} t & 0 & 1 & 2 & 3 & 4 & 5 & 6\\\hline N & 20 & 36 & 59 & 102 & 155 & 230 & 300\end{array}
An engineer proposes the model N=\dfrac{500}{1+Ce^{-kt}}, where C and k are positive constants.
(a) Show that, according to the model, the number of homes connected at t=0 is \dfrac{500}{1+C}. Show that \ln\!\left(\dfrac{500}{N}-1\right)=\ln C-kt.
[4]
(b) Let Z=\ln\!\left(\dfrac{500}{N}-1\right). Find the value of Z for each value of t, giving your answers to 3 decimal places. Find the equation of the regression line of Z on t.
[4]
(c) Hence find estimates for C and k. Use your model to find the time at which 450 homes are connected.
[4]
(d) Find the sum of square residuals of your model for the original data.
[3]
(e) Explain why this method could not be used if a reading of N were 500 or more, and suggest what the engineer could do if the number of homes that will eventually connect were not known.
[2]
Show solutionHide solution
(a) At t=0, e^0=1, so N=\dfrac{500}{1+C} (A1). Rearranging, \dfrac{500}{N}-1=Ce^{-kt} (M1); taking natural logarithms, \ln\!\left(\dfrac{500}{N}-1\right)=\ln C-kt (A1 AG). (b) Z: 3.178,\ 2.556,\ 2.012,\ 1.361,\ 0.800,\ 0.160,\ -0.405 (A1 A1). Regression: Z=-0.598t+3.18, from gradient -0.59832 and intercept 3.17525 (A1 A1). (c) C=e^{3.17525}=23.9 and k=0.598 (A1 A1). For 450 homes, t=\dfrac{\ln 9C}{k}=8.98 months (M1 A1). (d) Fitted values 20.1,\,35.3,\,60.7,\,100.5,\,156.9,\,227.1,\,301.1 (M1 A1); SS_{\mathrm{res}}=19.1 (A1). (e) If N\ge500 then \frac{500}{N}-1\le0 and has no logarithm (R1). Use logistic regression on the GDC, which also fits L, or estimate L from where the data level off and compare several values by SS_{\mathrm{res}} (R1).

Final answer

C=23.9, k=0.598; 8.98 months; SS_{\mathrm{res}}=19.1.

From the book

Photon Guidebook: Mathematics Applications and Interpretation HL for the IB Diploma

Chapter 7 teaches modelling with functions and regression from the basics to full exam questions: how the IB asks it, every question type with a marked example, and these practice questions in three steps.

About the book