Free worked solutions · 2026 Edition

IB Maths HL Paper 3 Chapter 15: Unfamiliar definitions and new structures worked solutions

Worked solutions to the investigations in Chapter 15 of Photon Guidebook: Mathematics HL Paper 3 for the IB Diploma (2026 Edition). Each solution shows every step with the mark it earns, the way an IB mark scheme does.

  • Chapter 15 of 18
  • 8 practice questions
  • 2 Going further
  • Free, no sign-up

Investigations

The practice investigations of the chapter, each with its full worked solution and mark scheme.

Investigation 1

[16 marks]
This question asks you to use a Lorenz curve to measure inequality.
In a town, the poorest proportion x of households receive a proportion L(x) of the total income. A measure of inequality is G = 1 - 2\displaystyle\int_0^1 L(x)\,\mathrm{d}x.
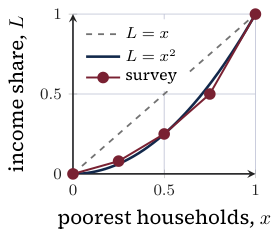
Original Photon diagram
(a) Explain why L(x) = x means perfect equality, and find G in that case.
[2]
(b) For L(x) = x^2, find G.
[3]
(c) For L(x) = x^k with k \ge 1, show that G = \dfrac{k - 1}{k + 1}.
[4]
(d) A survey gives L(0) = 0, L(0.25) = 0.08, L(0.5) = 0.25, L(0.75) = 0.5 and L(1) = 1. Use the trapezium rule to estimate G.
[4]
(e) Find the value of k for which x^k gives the same value of G as (d), and comment.
[3]
Show solutionHide solution
(a) with L(x)=x the poorest 10% of households receive 10% of the income, and the same holds for every proportion [R1]; G=1-2\int_0^1x\,\mathrm{d}x=1-2\times\frac12=0 [A1].
(b) G=1-2\int_0^1x^2\,\mathrm{d}x [M1]; \int_0^1x^2\,\mathrm{d}x=\frac13 [A1]; G=1-\frac23=\frac13 [A1].
(c) \int_0^1x^k\,\mathrm{d}x=\left[\frac{x^{k+1}}{k+1}\right]_0^1 [M1] =\frac1{k+1} [A1]; G=1-\frac2{k+1} [M1] =\frac{k-1}{k+1} [A1].
(d) five points with h=0.25: \int\approx\frac{0.25}2\big[0+2(0.08+0.25+0.5)+1\big] [M1] =\frac{0.25}2\times2.66 [A1] =0.3325 [A1]; G=1-2(0.3325)=0.335 [A1].
(e) \frac{k-1}{k+1}=0.335 [M1]; k=\frac{1+G}{1-G}=2.01 [A1]; k is close to 2, so the surveyed town is about as unequal as the curve L=x^2 [R1].

Final answer

  • (a) G=0
  • (b) \frac13
  • (c) G=\frac{k-1}{k+1}
  • (d) \int\approx0.3325, G=0.335
  • (e) k=2.01, close to the curve x^2.
Investigation 2

[16 marks]
This question asks you to use a weighted rating that damps the effect of a few votes.
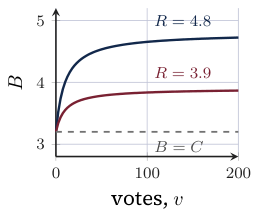
A film club ranks films by B = \dfrac{vR + mC}{v + m}, where R is the film's mean rating out of 5, v is the number of votes it has received, C = 3.2 is the mean rating over all films in the club and m = 10 is a fixed constant.
Original Photon diagram
(a) Film P has R = 4.8 from v = 5 votes. Find B.
[2]
(b) Film Q has R = 4.1 from 60 votes and film S has R = 3.9 from 400 votes. Find B for each, and give the ranking of P, Q and S by B and by R.
[3]
(c) Show that B - C = \dfrac{v}{v + m}(R - C), and explain why B always lies between C and R.
[3]
(d) A film has R = 4.8. Find the least number of votes for which B \ge 4.0.
[3]
(e) Find the limit of B as v \to \infty, and say what it shows about the role of C.
[3]
(f) Give one weakness of ranking films by B.
[2]
Show solutionHide solution
(a) B=\frac{5(4.8)+10(3.2)}{15} [M1] =\frac{56}{15}=3.73 [A1].
(b) Q: B=\frac{60(4.1)+32}{70}=3.97 [A1]; S: B=\frac{400(3.9)+32}{410}=3.88 [A1]; ranking by B: Q, S, P; ranking by R: P, Q, S [A1].
(c) B-C=\frac{vR+mC}{v+m}-\frac{(v+m)C}{v+m} [M1] =\frac{v(R-C)}{v+m} [A1]; 0<\frac{v}{v+m}<1, so B is C plus a fraction of the gap R-C, and lies between C and R [R1].
(d) \frac{4.8v+32}{v+10}\ge4 [M1]; 4.8v+32\ge4v+40, so 0.8v\ge8 [A1]; v\ge10: at least 10 votes [A1].
(e) B=\frac{R+mC/v}{1+m/v} [M1]; as v\to\infty, B\to R [A1]; with many votes a film is judged on its own rating, and C matters only while votes are few [R1].
(f) the constant m=10 is a choice, and the ranking can change if it changes [R1]; a block of fake or friendly votes still raises B [R1].

Final answer

  • (a) 3.73
  • (b) 3.97 and 3.88; by B: Q, S, P; by R: P, Q, S
  • (d) 10 votes
  • (e) B\to R.

Investigation 3

[20 marks]
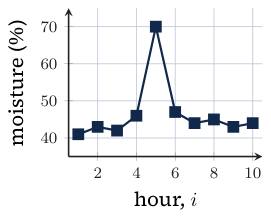
This question asks you to study a smoothing rule applied to hourly readings from a soil-moisture sensor.
A sensor records the moisture, as a percentage, once an hour. The ten readings x_1, x_2, \dots, x_{10} are 41, 43, 42, 46, 70, 47, 44, 45, 43, 44. Every reading except the first and the last is replaced by y_i = \dfrac{x_{i-1} + 2x_i + x_{i+1}}{4}, for i = 2, \dots, 9.
Original Photon diagram
(a) Find y_4, y_5 and y_6.
[3]
(b) Show that if every reading equals the same value c, then every smoothed reading equals c.
[2]
The rule is applied a second time, to y_2, \dots, y_9, giving z_i = \dfrac{y_{i-1} + 2y_i + y_{i+1}}{4} for i = 3, \dots, 8.
(c) Find z_5.
[3]
(d) Show that z_5 = \dfrac{x_3 + 4x_4 + 6x_5 + 4x_6 + x_7}{16}.
[4]
(e) A single spike of height H stands on a flat background of zero readings. Find the height of the spike, as a multiple of H, after one application and after two applications of the rule.
[3]
A second rule replaces every reading except the first and the last by the median of that reading and its two neighbours.
(f) Find the value this rule gives in place of x_5, and state how its effect on a sudden spike differs from that of the first rule.
[3]
(g) Give one drawback of smoothing sensor readings in this way.
[2]
Show solutionHide solution
(a) y_4=\frac{42+2(46)+70}4=51 [A1]; y_5=\frac{46+2(70)+47}4=58.25 [A1]; y_6=\frac{70+2(47)+44}4=52 [A1].
(b) y_i=\frac{c+2c+c}4 [M1] =\frac{4c}4=c [A1].
(c) z_5=\frac{y_4+2y_5+y_6}4 [M1] =\frac{51+116.5+52}4 [A1] =54.875\approx54.9 [A1].
(d) y_4=\frac{x_3+2x_4+x_5}4, y_5=\frac{x_4+2x_5+x_6}4, y_6=\frac{x_5+2x_6+x_7}4 [M1]; z_5=\frac1{16}\big[(x_3+2x_4+x_5)+2(x_4+2x_5+x_6)+(x_5+2x_6+x_7)\big] [M1]; coefficients of x_3,x_4,x_5,x_6,x_7 are 1, 2+2=4, 1+4+1=6, 2+2=4, 1 [A1]; so z_5=\frac{x_3+4x_4+6x_5+4x_6+x_7}{16} [A1].
(e) after one application the spike has height \frac24H=0.5H [A1]; after two, only the weight \frac6{16} of the middle term remains [M1]: \frac38H=0.375H [A1].
(f) the median of 46, 70 and 47 is 47 [A1]; the median rule removes the spike and returns a value in line with its neighbours [R1]; the first rule keeps part of the spike (58.25) and spreads it over the neighbouring hours (51 and 52) [R1].
(g) a genuine short event, such as a brief flood, is flattened and may be missed [R1]; the first and last readings cannot be smoothed, so the ends of the record are lost [R1].

Final answer

  • (a) 51, 58.25, 52
  • (c) 54.875
  • (e) \frac12H, \frac38H
  • (f) 47, the spike is removed.

Investigation 4

[22 marks]
This question asks you to explore a mean used by engineers, and to compare it with two familiar means.
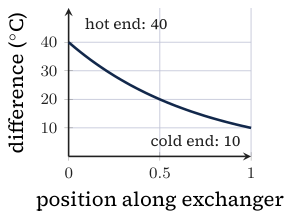
For positive numbers a < b, the logarithmic mean is M(a, b) = \dfrac{b - a}{\ln b - \ln a}. The geometric mean is \sqrt{ab} and the arithmetic mean is \dfrac{a + b}{2}.
Original Photon diagram
(a) Find M(1, 4) and compare it with the geometric and arithmetic means of 1 and 4.
[3]
(b) Repeat for a = 2, b = 3 and for a = 1, b = 100.
[3]
(c) Suggest an inequality connecting the three means.
[2]
(d) Show that M(ka, kb) = kM(a, b) for k > 0, and explain what this means.
[3]
(e) Use your GDC to find M(2, b) for b = 2.1, 2.01 and 2.001, and suggest the limit as b \to 2.
[3]
(f) A heat exchanger has temperature differences of 40^\circC at one end and 10^\circC at the other, falling as in the graph. Engineers use M(10, 40) as the average difference. Find it and the percentage by which the arithmetic mean would overestimate it.
[4]
(g) Find b such that M(10, b) = 20.
[4]
Show solutionHide solution
(a) M(1,4)=\frac{4-1}{\ln4-\ln1} [M1] =2.16 [A1]; the geometric mean is 2 and the arithmetic mean is 2.5, so 2<2.16<2.5 [A1].
(b) a=2,b=3: M=2.466, geometric 2.449, arithmetic 2.5 [A1]; a=1,b=100: M=\frac{99}{\ln100}=21.5, geometric 10, arithmetic 50.5 [A1]; in each case M lies between the geometric and the arithmetic mean [A1].
(c) \sqrt{ab}\le M(a,b)\le\frac{a+b}2 [A1]; the three means agree only when a=b [R1].
(d) M(ka,kb)=\frac{kb-ka}{\ln kb-\ln ka} [M1]; \ln kb-\ln ka=\ln b-\ln a, and kb-ka=k(b-a), so M(ka,kb)=kM(a,b) [M1]; if both numbers are multiplied by k (a change of units) the mean is multiplied by k, so the mean does not depend on the unit used [R1].
(e) M(2,2.1)=\frac{0.1}{\ln1.05}=2.0496 [M1]; M(2,2.01)=2.0050 and M(2,2.001)=2.0005 [A1]; the limit is 2, the common value when a=b [A1].
(f) M(10,40)=\frac{30}{\ln40-\ln10} [M1] =21.6\,{}^\circC [A1]; arithmetic mean 25, so the overestimate is \frac{25-21.6}{21.6} [M1] =15.5\% [A1].
(g) \frac{b-10}{\ln b-\ln10}=20 [M1]; solve numerically [M1]; b=35.1 [A1]; check with (c): \sqrt{351}=18.7<20<22.6 [R1].

Final answer

  • (a) 2.16, between 2 and 2.5
  • (b) 2.466 (2.449, 2.5) and 21.5 (10, 50.5)
  • (c) \sqrt{ab}\le M\le\frac{a+b}2
  • (e) 2.0496, 2.0050, 2.0005, limit 2
  • (f) 21.6\,{}^\circC, 15.5%
  • (g) b=35.1.

Investigation 5

[22 marks]
This question asks you to model a fish population in a pond from which fish are taken every year.
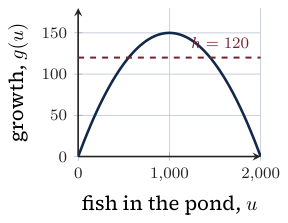
The number of fish in a pond at the start of year n is u_n. A model is u_{n+1} = u_n + 0.3u_n\left(1 - \dfrac{u_n}{2000}\right) - h, where h is the number of fish taken out each year. At the start of year 0 there are 400 fish.
Original Photon diagram
(a) With h = 0, find u_1 and u_2.
[2]
(b) With h = 0, show that the model has exactly two constant solutions, and write them down.
[3]
(c) With h = 0, find the first year in which the number of fish exceeds 1500.
[3]
(d) Show that for h = 120 the constant solutions satisfy u^2 - 2000u + 800\,000 = 0, and solve this equation.
[3]
(e) The yearly growth of the stock is g(u) = 0.3u\left(1 - \dfrac{u}{2000}\right). Find the greatest value of g(u) and the value of u at which it occurs.
[3]
(f) Hence find the largest value of h for which a constant solution exists, and explain what happens to the population when h is larger than this.
[3]
(g) With h = 120 and u_0 = 400, find u_1, u_2 and u_3, and explain why this harvesting policy fails.
[3]
(h) State one limitation of the model.
[2]
Show solutionHide solution
(a) u_1=400+0.3(400)(1-0.2)=496 [A1]; u_2=496+0.3(496)(1-0.248)=607.9 [A1].
(b) a constant solution has u_{n+1}=u_n, so 0.3u\left(1-\frac u{2000}\right)=0 [M1]; u=0 [A1] or u=2000 [A1].
(c) the terms are 400,\,496,\,607.9,\,734.8,\,874.3,\,1021.9,\,1171.8,\,1317.4,\,1452.3,\,1571.6 [M1]; u_8=1452.3 [A1]; u_9=1571.6>1500, so year 9 [A1].
(d) 0.3u\left(1-\frac u{2000}\right)=120 [M1]; 0.3u-0.00015u^2=120, and dividing by −0.00015 gives u^2-2000u+800\,000=0 [A1]; u=1000\pm\sqrt{200\,000}, so u=552.8 or u=1447.2 [A1].
(e) g'(u)=0.3-0.0003u=0 [M1]; u=1000 [A1]; g(1000)=0.3(1000)(0.5)=150 [A1].
(f) a constant solution needs g(u)=h, which has a solution only if h does not exceed the greatest value of g [R1]; the largest value is h=150 [A1]; if h>150 then g(u)-h<0 for every u, so the stock falls every year and the pond is emptied [R1].
(g) u_1=400+96-120=376, u_2=347.6, u_3=313.7 [A1]; 400 is below the lower constant solution 552.8 [M1]; there the growth is less than the harvest, so the stock falls each year towards zero [R1].
(h) the growth rate 0.3 is taken as constant, but real growth varies with the season, disease and food supply [R1]; the harvest is a fixed number whatever the stock, but real fishing takes more when fish are plentiful [R1].

Final answer

  • (a) 496, 607.9
  • (b) 0 and 2000
  • (c) year 9
  • (d) 552.8 and 1447.2
  • (e) 150 at u=1000
  • (f) h=150
  • (g) 376, 347.6, 313.7.

Investigation 6

[24 marks]
This question asks you to use a distance between two playlists that is defined in the question.
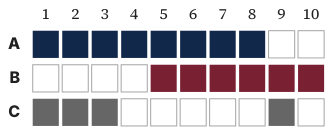
For two playlists X and Y, let s be the number of songs that are on both and t the number of songs that are on at least one. The distance between them is d(X, Y) = 1 - \dfrac{s}{t}. Three playlists hold the songs with these numbers (a filled square means the song is on the playlist).
Original Photon diagram
(a) Find d(\mathrm{A}, \mathrm{B}).
[2]
(b) Find d(\mathrm{A}, \mathrm{C}) and d(\mathrm{B}, \mathrm{C}).
[3]
(c) Verify that d(\mathrm{A}, \mathrm{C}) \le d(\mathrm{A}, \mathrm{B}) + d(\mathrm{B}, \mathrm{C}), and that the other two inequalities of this kind also hold for A, B and C.
[3]
(d) Explain why 0 \le d(X, Y) \le 1 for every pair of playlists, and say what d = 0 and d = 1 mean.
[3]
(e) A playlist X has 10 songs and a playlist Y has 6, with k songs on both. Show that d = \dfrac{16 - 2k}{16 - k}, and find the greatest and the least possible value of d.
[4]
(f) Treating k as a continuous variable, show that d decreases as k increases, and interpret this.
[4]
(g) A playlist E has 6 songs. Show that no playlist E can have d(\mathrm{A}, \mathrm{E}) = 0.5.
[3]
(h) Give one weakness of d as a measure of how alike two playlists sound.
[2]
Show solutionHide solution
(a) the playlists share songs 5, 6, 7 and 8, so s=4 [A1]; t=8+6-4=10, so d=1-\frac4{10}=0.6 [A1].
(b) A and C: s=3, t=8+4-3=9 [M1]; d(\mathrm{A},\mathrm{C})=1-\frac39=\frac23 [A1]; B and C share only song 9, so t=6+4-1=9 and d(\mathrm{B},\mathrm{C})=1-\frac19=\frac89 [A1].
(c) \frac23=0.667\le0.6+0.889=1.489 [A1]; 0.6\le\frac23+\frac89=1.556 [A1]; \frac89=0.889\le0.6+\frac23=1.267 [A1].
(d) the songs on both are among the songs on at least one, so 0\le s\le t, hence 0\le\frac st\le1 and 0\le d\le1 [R1]; d=0 when s=t: the playlists hold exactly the same songs [R1]; d=1 when s=0: they have no song in common [R1].
(e) t=10+6-k=16-k [M1]; d=1-\frac k{16-k}=\frac{16-2k}{16-k} [A1]; the greatest value is 1, when k=0 [A1]; the least is when all 6 songs of Y are on X, k=6: d=\frac4{10}=0.4 [A1].
(f) \frac{\mathrm{d}d}{\mathrm{d}k}=\frac{-2(16-k)+(16-2k)}{(16-k)^2} [M1]; the numerator is -32+2k+16-2k=-16 [A1]; \frac{-16}{(16-k)^2}<0, so d decreases as k increases [A1]; the more songs two playlists share, the closer they are, as a distance should behave [R1].
(g) t=8+6-s=14-s [M1]; 1-\frac s{14-s}=0.5 gives s=\frac{14}3 [A1]; the number of shared songs must be a whole number, so no playlist E has distance exactly 0.5 [R1].
(h) d counts only which songs are shared, not how they sound, so two playlists of different songs in the same style have d=1 [R1]; it ignores how long a song is or how often it is played [R1].

Final answer

  • (a) 0.6
  • (b) \frac23, \frac89
  • (c) 0.667\le1.489, 0.6\le1.556, 0.889\le1.267
  • (e) greatest 1, least 0.4
  • (f) \frac{\mathrm{d}d}{\mathrm{d}k}=\frac{-16}{(16-k)^2}
  • (g) s=\frac{14}3, not a whole number.

Investigation 7

[26 marks]
This question asks you to use a queueing model that is defined in the question to plan staffing at a kiosk.
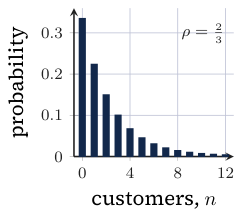
Customers arrive at a kiosk at an average rate of \lambda per hour and are served at an average rate of \mu per hour, where \lambda < \mu. In a standard queueing model, the probability that there are n customers at the kiosk (waiting or being served) is (1 - \rho)\rho^n, for n = 0, 1, 2, \dots, where \rho = \dfrac{\lambda}{\mu}.
Original Photon diagram
(a) Show that these probabilities add to 1.
[2]
(b) For \lambda = 20 and \mu = 30, find the probability that the kiosk is empty and the probability that there are at least 5 customers.
[4]
(c) The mean number of customers is L = \dfrac{\rho}{1 - \rho} and the mean time a customer spends at the kiosk is W = \dfrac{1}{\mu - \lambda} hours. Find L and W for \lambda = 20, \mu = 30, and verify that L = \lambda W.
[4]
(d) Show that \mathrm{P}(\text{at least } k \text{ customers}) = \rho^k.
[3]
(e) The owner, Ms Lim, wants the probability of 5 or more customers to be below 0.05. Find the least service rate needed.
[3]
(f) The hourly cost of serving at rate \mu is 0.5\mu dollars, and each customer at the kiosk costs 12 dollars per hour in lost goodwill. Show that the total hourly cost is C(\mu) = 0.5\mu + \dfrac{12\lambda}{\mu - \lambda}, and find the value of \mu that minimises it when \lambda = 20.
[7]
(g) Give two reasons why a real kiosk may not follow this model.
[3]
Show solutionHide solution
(a) \sum_{n=0}^\infty(1-\rho)\rho^n is geometric with first term 1-\rho and ratio \rho, where 0<\rho<1 [M1]; the sum is \frac{1-\rho}{1-\rho}=1 [A1].
(b) \rho=\frac{20}{30}=\frac23 [A1]; \mathrm{P}(0)=1-\rho=\frac13 [A1]; \mathrm{P}(\ge5)=1-\sum_{n=0}^{4}\frac13\left(\frac23\right)^n [M1] =0.132 [A1].
(c) L=\frac{2/3}{1/3}=2 customers [A1]; W=\frac1{30-20}=0.1 hours, that is 6 minutes [A1]; \lambda W=20\times0.1=2 [M1]; this equals L, so the relation holds [R1].
(d) \mathrm{P}(N\ge k)=\sum_{n=k}^\infty(1-\rho)\rho^n [M1]; geometric with first term (1-\rho)\rho^k and ratio \rho [A1]; the sum is \frac{(1-\rho)\rho^k}{1-\rho}=\rho^k [A1].
(e) \rho^5<0.05 [M1]; \rho<0.05^{1/5}=0.549 [A1]; \mu>\frac{20}{0.549}=36.4 per hour [A1].
(f) L=\frac{\lambda/\mu}{1-\lambda/\mu}=\frac{\lambda}{\mu-\lambda} [M1]; cost =0.5\mu+12L=0.5\mu+\frac{12\lambda}{\mu-\lambda} [M1]; for \lambda=20: C=0.5\mu+\frac{240}{\mu-20} and C'=0.5-\frac{240}{(\mu-20)^2} [M1]; correct derivative [A1]; C'=0 gives (\mu-20)^2=480 [A1]; \mu>\lambda, so \mu-20=+\sqrt{480} [R1]; \mu=41.9 per hour [A1].
(g) arrivals bunch at break times, so \lambda is not constant [R1]; service time depends on the order, so \mu varies [R1]; the geometric probabilities assume constant rates, so they are unreliable at busy times [R1].

Final answer

  • (a) geometric series
  • (b) \frac13, 0.132
  • (c) L=2, W=0.1 h
  • (d) geometric tail
  • (e) \mu>36.4 per hour
  • (f) (\mu-20)^2=480, \mu=41.9 per hour.

Investigation 8

[26 marks]
This question asks you to study a score that rewards honest probability forecasts.
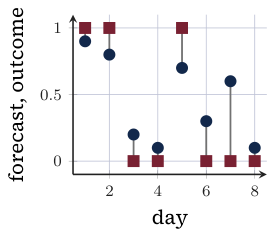
A forecaster states, for each day, a probability f that it will rain. Afterwards o = 1 if it rained and o = 0 if it did not. Over N days the Brier score is B = \dfrac{1}{N}\sum (f - o)^2, and a lower score is better. The diagram shows the eight days of part (b): a navy dot is a forecast and a claret square is the outcome, 1 for rain and 0 for dry.
Original Photon diagram
(a) A forecaster says f = 0.5 every day. Find B.
[2]
Over eight days Zoya forecast 0.9, 0.8, 0.2, 0.1, 0.7, 0.3, 0.6 and 0.1, and it rained on days 1, 2 and 5 only.
(b) Find Zoya's Brier score.
[3]
(c) Explain what B = 0 means, and find the greatest possible value of B and the forecasts that give it.
[3]
On a long run of days it rains with probability q on each day, independently. A forecaster states the same f = p every day.
(d) Show that the mean score per day is S(p) = p^2 - 2pq + q.
[2]
(e) Find the value of p that minimises S(p), and the least value of S. Interpret your answer.
[4]
(f) For q = 0.3, find S(0), S(0.3) and S(0.5).
[3]
A different score is the mean absolute error A = \dfrac{1}{N}\sum |f - o|.
(g) For the constant forecast p, show that the mean value of A is q + p(1 - 2q). For q = 0.3 find the value of p that minimises it, and hence explain why A is a poor score for honest forecasting.
[4]
The skill score of a set of forecasts is 1 - \dfrac{B}{B_0}, where B_0 = \bar{o}(1 - \bar{o}) and \bar{o} is the proportion of days on which it rained.
(h) Find Zoya's skill score and interpret it.
[3]
(i) Give one weakness of the Brier score for comparing two forecasters.
[2]
Show solutionHide solution
(a) every term is (0.5-o)^2=0.25 [M1]; so B=0.25 [A1].
(b) the squared errors are 0.01,\,0.04,\,0.04,\,0.01,\,0.09,\,0.09,\,0.36,\,0.01 [A1]; their sum is 0.65 [M1]; B=\frac{0.65}8=0.0813 [A1].
(c) B=0 means every forecast was exactly right [R1]; each term is at most 1, so B\le1 and the greatest value is 1 [A1]; it happens when every forecast is 0 or 1 and every one is wrong [R1].
(d) it rains with probability q, giving a squared error (p-1)^2, and is dry with probability 1-q, giving p^2: S=q(1-p)^2+(1-q)p^2 [M1]; =q-2pq+qp^2+p^2-qp^2=p^2-2pq+q [A1].
(e) S'(p)=2p-2q=0 [M1]; p=q [A1]; S(q)=q^2-2q^2+q=q(1-q) [A1]; the best constant forecast is the true chance of rain, so the score rewards honesty [R1].
(f) S(0)=0.3 [A1]; S(0.3)=0.09-0.18+0.3=0.21 [A1]; S(0.5)=0.25-0.3+0.3=0.25 [A1].
(g) A=q(1-p)+(1-q)p=q+p(1-2q) [M1]; for q=0.3, A=0.3+0.4p [A1]; this increases with p, so it is least at p=0 [A1]; always saying “no rain” scores 0.3, better than the honest p=0.3, which scores 0.42, so A does not reward honest forecasts [R1].
(h) \bar o=\frac38, so B_0=\frac38\times\frac58=0.234 [M1]; skill score =1-\frac{0.0813}{0.234}=0.653 [A1]; Zoya's forecasts cut the score by about 65% compared with always forecasting the long-run frequency of rain [R1].
(i) it depends on how often it rains: a forecaster in a dry place scores well by always forecasting a low chance [R1]; forecasters must be compared over the same days, and a few days give a noisy score [R1].

Final answer

  • (a) 0.25
  • (b) 0.0813
  • (c) B=0 perfect, greatest 1
  • (e) p=q, S=q(1-q)
  • (f) 0.3, 0.21, 0.25
  • (g) p=0
  • (h) 0.653.

Going further

Beyond the syllabus: the worked examples and investigations of the chapter's Going further pages.

Investigation

[26 marks]
Worked investigation 1: How diverse is a meadow.
This question asks you to use an index of diversity that you have not met before to compare two habitats.
For a habitat with n species whose proportions of the individuals are p_1, p_2, \dots, p_n, an ecologist defines D = p_1^2 + p_2^2 + \dots + p_n^2, and uses 1 - D as an index of diversity.
In meadow M, a survey finds 40 daisies, 30 buttercups, 20 clovers and 10 orchids.
(a) Find D and the diversity index for meadow M.
[2]
(b) Explain why D is the probability that two plants chosen at random, with replacement, are of the same species.
[2]
(c) For a habitat with two species in proportions p and 1 - p, find the value of p that minimises D, and the minimum value.
[3]
(d) For three species in proportions p, q and 1 - p - q, show that for a fixed q, D is least when p = \dfrac{1 - q}{2}. Hence find the least value of D for three species.
[5]
(e) Suggest the least value of D for n species, and the proportions that give it.
[2]
In meadow N, the survey finds 70 daisies, 10 buttercups, 10 clovers and 10 orchids.
(f) Find the diversity index for meadow N and compare the two meadows.
[2]
(g) If the two plants are chosen without replacement, the probability is \displaystyle\sum \frac{n_i(n_i - 1)}{N(N - 1)}, where n_i is the count of species i and N the total. Find this for meadow M, and explain why it is close to D.
[3]
(h) The value \dfrac{1}{D} is called the effective number of species. Find it for both meadows and interpret it.
[3]
(i) Ten poppies are found in meadow M. Find the new value of D.
[2]
(j) Give one weakness of 1 - D as a measure of the value of a habitat.
[2]
Show solutionHide solution
(a) proportions 0.4,\,0.3,\,0.2,\,0.1; D=0.4^2+0.3^2+0.2^2+0.1^2 [M1]
D=0.16+0.09+0.04+0.01=0.30; diversity index 1-D=0.70 [A1]
(b) the probability that both plants are species i is p_i\times p_i=p_i^2, since the choices are independent (with replacement) [R1]
the species are mutually exclusive, so adding over all species gives \sum p_i^2=D [R1]
(c) D=p^2+(1-p)^2=2p^2-2p+1 [M1]
\dfrac{\mathrm{d}D}{\mathrm{d}p}=4p-2=0, so p=\dfrac12 [A1]
D_{\min}=\dfrac14+\dfrac14=\dfrac12 [A1]
(d) D=p^2+q^2+(1-p-q)^2; differentiate with respect to p with q fixed: \dfrac{\partial D}{\partial p}=2p-2(1-p-q) [M1]
=4p-2(1-q)=0, so p=\dfrac{1-q}{2} [A1]
substitute: D(q)=q^2+2\left(\dfrac{1-q}{2}\right)^2=q^2+\dfrac{(1-q)^2}{2} [M1]
D'(q)=2q-(1-q)=3q-1=0, so q=\dfrac13 [A1]
D_{\min}=\dfrac19+\dfrac{(2/3)^2}{2}=\dfrac13 [A1]
(e) the least value is \dfrac1n [A1]
it occurs when all n species have the same proportion \dfrac1n [A1]
(f) D=0.7^2+3(0.1)^2=0.52; index 1-D=0.48 [A1]
0.48<0.70: meadow M is more diverse than meadow N [R1]
(g) \sum n_i(n_i-1)=40(39)+30(29)+20(19)+10(9)=2900 [M1]
probability =\dfrac{2900}{100\times99}=0.293 [A1]
N is large, so n_i-1\approx n_i and N-1\approx N; the two probabilities nearly agree [R1]
(h) meadow M: \dfrac1{0.30}=3.33 [A1]
meadow N: \dfrac1{0.52}=1.92 [A1]
meadow M behaves as if it held 3.33 equally common species, meadow N only 1.92, because daisies dominate it [R1]
(i) new total 110; D=\dfrac{40^2+30^2+20^2+10^2+10^2}{110^2} [M1]
D=\dfrac{3100}{12100}=0.256 [A1]
(j) it depends only on proportions, so a rare species that matters (for example one that is protected) counts very little [R1]
it ignores how many plants there are: ten plants and ten thousand plants in the same proportions give the same value [R1]

Final answer

  • (a) D=0.30, index 0.70
  • (c) p=\frac12, D=\frac12
  • (d) p=\frac{1-q}{2}, least D=\frac13
  • (e) \frac1n
  • (f) 0.48, so M is more diverse
  • (g) 0.293
  • (h) 3.33, 1.92
  • (i) 0.256.

Investigation

[26 marks]
Worked investigation 2: Ratings for a chess club.
This question asks you to study a rating system in which each game moves the players' ratings.
In a chess club, a player with rating R_A playing a player with rating R_B has expected score E_A = \dfrac{1}{1 + 10^{(R_B - R_A)/400}}. After a game, R_A is replaced by R_A + 32(S_A - E_A), where S_A is 1 for a win and 0 for a loss.
(a) Find E_A when R_A = 1600 and R_B = 1400.
[2]
(b) Show that E_A + E_B = 1 for any ratings.
[3]
(c) The player rated 1600 loses to the player rated 1400. Find both new ratings.
[3]
(d) Show that the sum of the two ratings never changes after a game.
[2]
(e) Let d = R_A - R_B. Find \dfrac{\mathrm{d}E_A}{\mathrm{d}d} when d = 0, and interpret it.
[4]
(f) Find the rating difference for which the stronger player's expected score is 0.9.
[3]
(g) Ahmed, rated 1500, plays three games against opponents who are each rated 1500 at the time of the game, and wins all three. Find his rating after each game.
[4]
(h) The club wants a win by a player rated 1400 over a player rated 1600 to gain exactly 20 points. Find the value that should replace 32.
[3]
(i) Suggest one weakness of this rating system.
[2]
Show solutionHide solution
(a) E_A=\dfrac1{1+10^{(1400-1600)/400}}=\dfrac1{1+10^{-0.5}} [M1]
E_A=0.760 [A1]
(b) let x=\dfrac{R_B-R_A}{400}; then E_A=\dfrac1{1+10^{x}} and E_B=\dfrac1{1+10^{-x}} [M1]
E_B=\dfrac{10^{x}}{10^{x}+1}, multiplying top and bottom by 10^{x} [M1]
E_A+E_B=\dfrac{1+10^{x}}{1+10^{x}}=1 [A1]
(c) E_A=0.7597 so R_A'=1600+32(0-0.7597) [M1]
R_A'=1575.7 [A1]
E_B=1-0.7597=0.2403, R_B'=1400+32(1-0.2403)=1424.3 [A1]
(d) change of R_A is 32(S_A-E_A); change of R_B is 32(S_B-E_B), and S_A+S_B=1, E_A+E_B=1 [M1]
total change =32\big((S_A+S_B)-(E_A+E_B)\big)=32(1-1)=0 [R1]
(e) E_A=(1+10^{-d/400})^{-1}, so \dfrac{\mathrm{d}E_A}{\mathrm{d}d}=\dfrac{\ln10}{400}\,10^{-d/400}\,(1+10^{-d/400})^{-2} [M1]
correct derivative (signs resolved) [A1]
at d=0: \dfrac{\ln10}{400}\times1\times\dfrac14=\dfrac{\ln10}{1600}=0.00144 [A1]
near equal strength, 10 extra rating points raise the expected score by about 0.0144, that is 1.4 percentage points [R1]
(f) \dfrac1{1+10^{-d/400}}=0.9, so 10^{-d/400}=\dfrac19 [M1]
\dfrac d{400}=\log_{10}9 [A1]
d=400\log_{10}9=382 rating points [A1]
(g) equal ratings: E=0.5, so R=1500+32(1-0.5)=1516 [A1]
second game: Ahmed is now 1516 against 1500, so E=\dfrac1{1+10^{-16/400}}=0.5230 [M1]
R=1516+32(1-0.5230)=1531.3 [A1]
third game: E=0.5449 and R=1531.3+32(1-0.5461)=1545.8 [A1]
(h) E for the player rated 1400 against 1600 is 0.2403 [M1]
k(1-0.2403)=20 [M1]
k=\dfrac{20}{0.7597}=26.3 [A1]
(i) a player with few games has an unreliable rating, yet it moves as much as an established player's [R1]
the rule has no way to score a draw, which is a common result in chess [R1]

Final answer

  • (a) 0.760
  • (c) 1575.7, 1424.3
  • (e) 0.00144 per rating point
  • (f) 382
  • (g) 1516, 1531.3, 1545.8
  • (h) 26.3.

From the book

Photon Guidebook: Mathematics HL Paper 3 for the IB Diploma

Chapter 15 teaches unfamiliar definitions and new structures: how the IB builds this kind of Paper 3 question, the techniques, marked worked investigations, and practice investigations like these.

About the book