Free worked solutions · 2026 Edition

IB Maths AI SL Chapter 8: Describing data worked solutions

Worked solutions to the practice questions in Chapter 8 of Photon Guidebook: Mathematics Applications and Interpretation SL for the IB Diploma (2026 Edition). Each solution shows every step with the mark it earns, the way an IB mark scheme does.

  • Chapter 8 of 15
  • 26 practice questions
  • 3 Going further
  • Free, no sign-up

Basics

One idea at a time, in the order the chapter teaches them.

Question 1

[2 marks]
A depot orders 1560 tool records by inventory number. An auditor picks a random start from 1 to 26 and then checks every 26th record.
Name the sampling method and state its sampling interval.
[2]
Show solutionHide solution
Systematic sampling.
A1
Interval: 26 records.
A1

Final answer

systematic sampling; interval 26 records

Question 2

[4 marks]
A federation has 315 members in group A, 245 in group B and 140 in group C. A proportional stratified random sample of 80 is planned.
Find the required sample size for each group and describe how to select the people within a group.
[4]
Show solutionHide solution
Total =700; use n_i=80N_i/700.
M1
A:36, B:28, C:16.
A2
Select the stated number uniformly at random without replacement from each group list.
R1

Final answer

A 36, B 28, C 16; choose at random within each group list

Question 3

[2 marks]
A cafe manager asks the first 30 customers arriving after 7 am about the preferred closing time.
Identify the selection method and give a specific reason the answers might not represent all customers.
[2]
Show solutionHide solution
Convenience sampling.
A1
Only early-arriving customers are included; evening customers may prefer a different closing time.
R1

Final answer

convenience sampling; only early customers are asked

Question 4

[3 marks]
The table records late deliveries per week.
Late deliveries013
Frequency58k
The mean is exactly 1.4.
Determine whether any non-negative integer frequency k can satisfy this claim. Justify your answer.
[3]
Show solutionHide solution
[8+3k]/[13+k]=1.4
M1
8+3k=18.2+1.4k
M1
k=6.375, so no integer frequency is possible.
A1

Final answer

k=6.375: no whole-number frequency works

Question 5

[2 marks]
The masses (g) of six prototype clips are 17,\ 22,\ 24,\ 27,\ 31,\ 35.
Use one-variable statistics to find the population standard deviation, to 3 significant figures.
[2]
Show solutionHide solution
Enter the six masses in one-variable statistics; select \sigma_x.
M1
\sigma_x=5.89 g.
A1

Final answer

\sigma=5.89 g

Question 6

[3 marks]
An observation is an outlier if it is strictly below Q_1-1.5\mathrm{IQR} or strictly above Q_3+1.5\mathrm{IQR}. A data set has Q_1=29 and Q_3=41.
Determine which of 10, 11 and 60 would be outliers.
[3]
Show solutionHide solution
\mathrm{IQR}=12; fences 29-18=11 and 41+18=59.
M1
10 and 60 are outside the fences and are outliers.
A1
11 is on the boundary, so is not an outlier.
A1

Final answer

fences 11 and 59: 10 and 60 are outliers, 11 is not

Question 7

[4 marks]
Two ordinary box plots of battery duration have summaries A: (42,55,63,68,79), B: (39,51,60,73,86), in hours.
Compare typical duration using the medians and compare the widths of the middle-half intervals.
[4]
Show solutionHide solution
Medians: A 63 h, B 60 h; A is 3 h higher.
A1
A middle-half width 68-55=13 h.
A1
B middle-half width 73-51=22 h.
A1
A has the narrower middle-half interval by 9 h.
R1

Final answer

medians A 63 h, B 60 h; middle-half widths 13 h and 22 h, so A is narrower by 9 h

Question 8

[3 marks]
The grouped table records packing times.
Time (s)Frequency
12\le t<185
18\le t<249
24\le t<304
Estimate the mean time from class midpoints.
[3]
Show solutionHide solution
Midpoints 15,21,27; N=18.
A1
\bar{t}\approx[15(5)+21(9)+27(4)]/18
M1
\bar{t}\approx20.7 s (unrounded 20.666\dots).
A1

Final answer

20.7 s

Question 9

[4 marks]
A balance overstates every mass by exactly 2.7 g. Recorded masses have mean 48.6 g and population standard deviation 3.2 g.
(a) Find the corrected mean.
[2]
(b) State the corrected standard deviation and explain.
[2]
Show solutionHide solution
(a) 48.6-2.7
M1
45.9 g.
A1
(b) 3.2 g.
A1
Subtracting the same constant leaves each deviation from the mean unchanged.
R1

Final answer

  • (a) 45.9 g
  • (b) 3.2 g, unchanged

Question 10

[3 marks]
A cumulative-frequency polygon for 80 readings joins (0,0), (5,12), (10,44), (15,68), (20,80). Percentile p is read at cumulative frequency pN/100.
Estimate the 60th percentile using straight segments.
[3]
Show solutionHide solution
Target cumulative frequency 0.60(80)=48.
M1
10+(48-44)(5)/(68-44).
M1
10.83 (approximately).
A1

Final answer

10.8 (10.83)

Tutorial

Exam-style questions on each question type, with the marks the IB would give.

Question 11

[5 marks]
Dev wants to know how the 52 000 registered cyclists in his city feel about a new bike lane. On a Monday morning he stands beside the central bridge and asks the first 60 cyclists who ride past.
(a) Write down the population and the sample in Dev’s survey.
[2]
(b) Name the sampling method Dev used.
[1]
(c) Give one reason why Dev’s sample may be biased.
[1]
(d) Dev says: “If I had asked 600 cyclists in the same way, the bias would disappear.” State whether he is correct, giving a reason.
[1]
Show solutionHide solution
(a) Population: all 52 000 registered cyclists in the city.
A1[1]
Sample: the 60 cyclists Dev asked.
A1[1]
(b) Convenience sampling (he asked whoever was easiest to reach).
A1[1]
(c) Only cyclists who use that bridge at that time on a Monday morning are asked, so leisure cyclists and those using other routes have no chance of being chosen (or: those who stop to answer may feel strongly about the lane).
R1[1]
(d) He is not correct: a larger sample taken by the same method has the same bias, because the problem is how the cyclists are chosen, not how many.
R1[1]

Final answer

  • (a) all 52 000 registered cyclists; the 60 asked
  • (b) convenience
  • (c) only bridge users on a Monday morning
  • (d) no: the same method gives the same bias

Question 12

[7 marks]
Farid lists the prices, in dollars, of nine second-hand bicycles advertised in his neighbourhood:
120, 135, 135, 150, 155, 160, 175, 192, 780.
(a) Use your GDC to find the mean, the median and the mode of the prices.
[3]
(b) Farid wants a single price to quote as the “typical” price. State which of the three averages is best, giving a reason.
[2]
(c) The \$780 bicycle is withdrawn from sale. Find the new mean and the new median.
[2]
Show solutionHide solution
(a) Enter the prices in a list and run One-Variable Statistics: \bar x=222.4444.
A1[1]
Mean =\$222 (3 s.f.), median =\$155, mode =\$135. A1A1
[2]
(b) The median (\$155): the mean is pulled up by the single very high price of \$780 and is larger than eight of the nine prices. A1R1
[2]
(c) New mean =\dfrac{1222}{8}=152.75\approx\$153.
A1[1]
New median =\dfrac{150+155}{2}=\$152.5.
A1[1]

Final answer

  • (a) USD 222, USD 155, USD 135
  • (b) the median
  • (c) USD 153 (152.75); USD 152.50

Question 13

[7 marks]
A travel agency asks 50 passengers in a departure lounge how many different countries, x, they have visited.
\begin{array}{|l|c|c|c|c|c|} \hline \text{Countries} x & \text{0} & \text{1} & \text{2} & \text{3} & \text{4} \\ \hline \text{Number of passengers} & \text{5} & a & \text{12} & b & \text{6} \\ \hline \end{array}
The mean number of countries visited is 2.34.
(a) Write down an equation connecting a and b.
[1]
(b) Show that a+3b=69.
[2]
(c) Hence find a and b.
[2]
(d) Find the median and the mode of the number of countries visited.
[2]
Show solutionHide solution
(a) 5+a+12+b+6=50, so a+b=27.
A1[1]
(b) \sum fx=0(5)+a+2(12)+3b+4(6)=a+3b+48.
M1[1]
\dfrac{a+3b+48}{50}=2.34, so a+3b+48=117 and a+3b=69. M1AG
[1]
(c) Subtract: (a+3b)-(a+b)=69-27, so 2b=42.
M1[1]
b=21 and a=6 (GDC simultaneous-equation solver gives the same).
A1[1]
(d) Cumulative frequencies 5, 11, 23, 44, 50: the 25th and 26th values are both 3, so median =3.
A1[1]
Mode =3 (frequency 21).
A1[1]

Final answer

  • (a) a+b=27
  • (c) a=6, b=21
  • (d) median 3, mode 3

Question 14

[6 marks]
Ravi can travel to work by tram or by ferry. He times eight trips on each route; the times, in minutes, are:
\begin{array}{|l|c|} \hline \text{Tram} & \text{24, 26, 25, 27, 23, 26, 25, 24} \\ \hline \text{Ferry} & \text{19, 31, 22, 28, 20, 33, 24, 23} \\ \hline \end{array}
(a) Show that the mean trip time is 25 minutes on both routes.
[2]
(b) Use your GDC to find the standard deviation \sigma_x for each route.
[2]
(c) Ravi has an important meeting and wants the route whose trip times are more predictable. State which route he should choose, justifying your answer with your answer to (b).
[1]
(d) Give a second measure of spread that supports your answer to (c), and calculate it for each route.
[1]
Show solutionHide solution
(a) Tram: \dfrac{200}{8}=25.
M1[1]
Ferry: \dfrac{200}{8}=25. M1AG
[1]
(b) One-Variable Statistics on each list: tram \sigma_x=1.2247=1.22 min.
A1[1]
Ferry \sigma_x=4.7958=4.80 min.
A1[1]
(c) The tram: its standard deviation (1.22) is much smaller than the ferry’s (4.80), so its times vary much less around the same mean.
R1[1]
(d) Range: tram 27-23=4 min, ferry 33-19=14 min (or IQR 2 and 8.5); the tram has the smaller spread by either measure.
A1[1]

Final answer

  • (a) 25 min both
  • (b) tram 1.22 min, ferry 4.80 min
  • (c) tram
  • (d) ranges 4 and 14 min

Question 15

[6 marks]
A botanist grows 40 seedlings under each of two types of lamp, A and B, and records the heights, h cm, after four weeks.
Height h (cm)Lamp ALamp B
10\le h<1538
15\le h<2097
20\le h<251610
25\le h<3099
30\le h<3536
(a) For lamp A, use mid-interval values to estimate the mean and the standard deviation \sigma_x of the heights.
[2]
(b) Repeat part (a) for lamp B.
[2]
(c) Compare the two lamps, referring to both centre and spread. Explain why your answers are only estimates.
[2]
Show solutionHide solution
(a) Midpoints 12.5,\,17.5,\,22.5,\,27.5,\,32.5 in one list, frequencies in another; One-Variable Statistics.
M1[1]
\bar x=22.5 cm, \sigma_x=5.1235=5.12 cm.
A1[1]
(b) Lamp B: \bar x=22.25 cm.
M1[1]
\sigma_x=6.7035=6.70 cm.
A1[1]
(c) The mean heights are almost the same (22.5 and 22.25 cm), so neither lamp gives taller seedlings on average, but lamp B gives much more variable heights (\sigma_x=6.70 against 5.12).
R1[1]
The values are estimates because each seedling is treated as if its height were the midpoint of its class.
R1[1]

Final answer

  • (a) 22.5 cm, 5.12 cm
  • (b) 22.25 cm, 6.70 cm
  • (c) similar means; B more variable

Question 16

[7 marks]
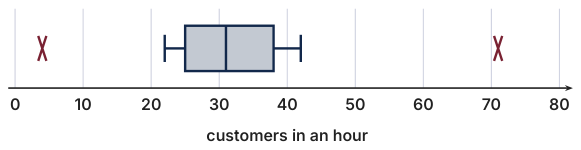
A food-truck owner counts the customers served in each of 15 busy hours:
4, 22, 24, 25, 27, 28, 30, 31, 33, 34, 35, 38, 40, 42, 71.
(a) Use your GDC to write down the median and the quartiles.
[2]
(b) Show that both 4 and 71 are outliers, and that no other value is an outlier.
[3]
(c) Draw a box plot of the data on a scale from 0 to 80, showing the outliers separately.
[2]
Show solutionHide solution
(a) One-Variable Statistics: Q_1=25, median =31, Q_3=38. A1A1
[2]
(b) IQR =38-25=13, so 1.5\times\text{IQR}=19.5.
M1[1]
Fences: 25-19.5=5.5 and 38+19.5=57.5.
A1[1]
4<5.5 and 71>57.5, so both are outliers; all other values lie between 22 and 42, inside the fences, so none of them is an outlier.
R1[1]
(c) The whiskers stop at the most extreme values that are not outliers, 22 and 42; the outliers 4 and 71 are marked separately. A1A1
[2]
Original Photon diagram

Final answer

  • (a) 25, 31, 38
  • (b) fences 5.5 and 57.5
  • (c) whiskers 22 and 42; crosses at 4 and 71

Question 17

[6 marks]
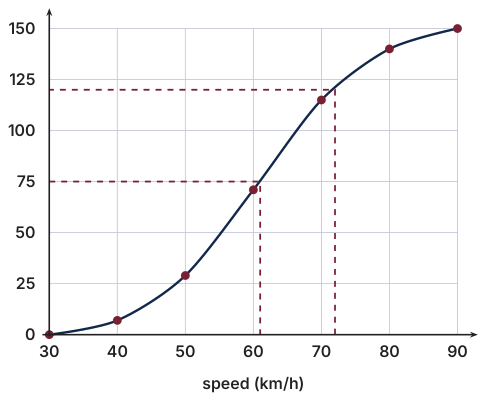
A speed camera records the speed, v km/h, of 150 cars. The cumulative frequency table is partly filled in.
Speed less thanCum. frequency
407
5029
6071
70a
80140
90150
Exactly 25 cars had speeds in the class 70\le v<80.
(a) Find the number of cars with speeds in the class 50\le v<60.
[1]
(b) Find the value of a.
[1]
(c) Draw the cumulative frequency graph and use it to estimate the median speed.
[2]
(d) The speed limit is 72 km/h. Estimate the number of cars that were exceeding it.
[2]
Show solutionHide solution
(a) 71-29=42 cars.
A1[1]
(b) a=140-25=115.
A1[1]
(c) Plot (30,0),(40,7),(50,29),(60,71),(70\,115),(80\,140),(90\,150) and draw a smooth curve.
M1[1]
Median: cumulative frequency 75 gives a speed of \approx61 km/h.
A1[1]
(d) At 72 km/h the cumulative frequency is \approx120.
M1[1]
Cars above the limit \approx150-120=30 (tolerance \pm3).
A1[1]
Original Photon diagram

Final answer

  • (a) 42
  • (b) a=115
  • (c) median about 61 km/h
  • (d) about 30 cars

Question 18

[6 marks]
Two cafés record how long customers wait, in minutes, to be served. The five-number summaries are shown.
Café ACafé B
Minimum23
Q_156
Median89
Q_31211
Maximum2115
(a) Find the range and the interquartile range for each café.
[2]
(b) Write down one comparison of the centres and one comparison of the spreads of the two sets of waiting times.
[2]
(c) The manager of café A says: “We are the faster café, because our shortest wait is only 2 minutes.” Comment on this statement.
[1]
(d) At café B, what percentage of customers wait less than 6 minutes?
[1]
Show solutionHide solution
(a) A: range =21-2=19, IQR =12-5=7.
A1[1]
B: range =15-3=12, IQR =11-6=5.
A1[1]
(b) Centre: café A has the lower median (8 against 9), so a typical customer waits slightly less at A.
R1[1]
Spread: café B has the smaller IQR and range, so its waiting times are more consistent.
R1[1]
(c) The minimum is a single extreme value and says nothing about a typical customer; the median and the much longer upper tail (21 minutes) matter more.
R1[1]
(d) Q_1=6, so 25%.
A1[1]

Final answer

  • (a) A 19, 7; B 12, 5
  • (b) A lower median; B more consistent
  • (c) the minimum is one value
  • (d) 25%

Question 19

[6 marks]
In a quiz, a contestant’s score is y=100-2x, where x is the number of seconds taken. For x, the mean is 38, the standard deviation is 6, the median is 40, the interquartile range is 9 and the range is 25.
(a) Find the mean and the standard deviation of the scores y.
[2]
(b) Find the median and the interquartile range of the scores.
[2]
(c) Explain why the standard deviation of y is 12 and not −12.
[1]
(d) Find the range of the scores.
[1]
Show solutionHide solution
(a) Mean =100-2(38)=24.
A1[1]
Standard deviation =|-2|\times6=12.
A1[1]
(b) Median =100-2(40)=20.
A1[1]
IQR =2\times9=18 (the order is reversed, so the sign does not matter).
A1[1]
(c) A standard deviation measures an amount of scatter and cannot be negative; multiplying by −2 reflects the data but stretches the spread by |-2|=2.
R1[1]
(d) Range =2\times25=50.
A1[1]

Final answer

  • (a) 24, 12
  • (b) 20, 18
  • (c) spread cannot be negative
  • (d) 50

Question 20

[6 marks]
Class A has 24 students whose mean mark in a statistics test is 61.5. Class B has 36 students whose mean mark is 70.0.
(a) Find the mean mark of all 60 students.
[3]
(b) A student from Class A who scored 45 is later found to have taken a different version of the test, and her mark is removed. Find the mean mark of the remaining 23 students in Class A.
[2]
(c) Karl finds the mean of the two class means and gets 65.75. Explain why this is not the mean of all 60 students.
[1]
Show solutionHide solution
(a) Total for A =24\times61.5=1476.
M1[1]
Total for B =36\times70=2520.
M1[1]
Mean =\dfrac{1476+2520}{60}=\dfrac{3996}{60}=66.6.
A1[1]
(b) New total =1476-45=1431.
M1[1]
New mean =\dfrac{1431}{23}=62.217\ldots\approx62.2.
A1[1]
(c) The classes have different sizes, so Class B (the larger) must count for more; the correct mean weights each class mean by its number of students.
R1[1]

Final answer

  • (a) 66.6
  • (b) 62.2
  • (c) the classes differ in size

Mastery

Full exam questions that mix question types, at Paper 1 and Paper 2 standard.

Question 21

[8 marks]
The eight waiting times, in minutes, recorded at a drive-through window are
7, 9, 11, 14, 15, 17, 20, k,
where k\ge20 is a whole number.
(a) Show that the quartiles Q_1 and Q_3 do not depend on k, and find them.
[2]
(b) Find the least value of k for which k is an outlier.
[3]
(c) Find the values of k for which the mean of the eight times exceeds their median.
[3]
Show solutionHide solution
(a) Lower half 7,9,11,14 gives Q_1=\dfrac{9+11}{2}=10; upper half 15,17,20,k with k\ge20 gives Q_3=\dfrac{17+20}{2}=18.5. M1A1
[2]
(Neither value involves k because k is the largest value, so the two middle values of the upper half are 17 and 20.)
(b) IQR =18.5-10=8.5, so 1.5\times8.5=12.75.
M1[1]
Upper fence =18.5+12.75=31.25.
A1[1]
k is an outlier when k>31.25: least whole number k=32.
A1[1]
(c) Median =\dfrac{14+15}{2}=14.5 (for every k\ge20).
A1[1]
Sum of the seven known values =93, so \dfrac{93+k}{8}>14.5, giving 93+k>116.
M1[1]
k>23, so k\ge24.
A1[1]

Final answer

  • (a) Q_1=10, Q_3=18.5
  • (b) k=32
  • (c) k\ge24

Question 22

[10 marks]
A researcher measures the reaction times (in milliseconds) of 100 participants. The grouped data are shown, but one frequency is missing.
Reaction time r (ms)Frequency
180\le r<2008
200\le r<22022
220\le r<240k
240\le r<26025
260\le r<28011
(a) Show that k=34.
[2]
(b) Using mid-interval values, estimate the mean reaction time.
[3]
(c) Estimate the standard deviation of the reaction times using your GDC.
[2]
(d) Write down the modal class, and state which class contains the median.
[3]
Show solutionHide solution
(a) Total is 100: 8+22+k+25+11=100\Rightarrow66+k=100\Rightarrow k=34.
[2]
(b) Mid-values 190 210 230 250 270. \sum fx=190(8)+210(22)+230(34)+250(25)+270(11)=1520+4620+7820+6250+2970=23\,180. \bar r=23\,180/100=231.8 ms.
[3]
(c) From GDC (mid-values with frequencies): \sigma\approx22.1 ms.
[2]
(d) Modal class =220\le r<240 (highest frequency 34). Cumulative: 8,30,64,\dots The 50th and 51st values fall in 220\le r<240, so the median lies in that class.
[3]

Final answer

  • (a) k=34
  • (b) 231.8 ms
  • (c) 22.1 ms
  • (d) modal class and median class both 220\le r<240

Question 23

[11 marks]
A cycling club records the finishing times (in minutes) of 80 riders in a race. The times are grouped below.
Time t (min)Frequency
40\le t<456
45\le t<5014
50\le t<5526
55\le t<6020
60\le t<6510
65\le t<704
(a) Copy and complete the cumulative frequency values for the upper boundary of each class (45,50,55,60,65,70).
[2]
(b) On graph paper you draw a cumulative frequency curve. Use it (or the table) to estimate:
(i) the median time; (ii) the 90th percentile.
[4]
(c) Riders finishing in under 48 minutes qualify for the regional final. Estimate how many riders qualify.
[3]
(d) Using mid-interval values, estimate the mean finishing time.
[2]
Show solutionHide solution
(a) Cumulative frequencies at 45,50,55,60,65,70: 6,20,46,66,76,80.
[2]
(b) (i) Median at CF =40: lies in 50\le t<55. Interpolating: 50+\dfrac{40-20}{26}\times5=50+3.85=53.8 min. (ii) 90% of 80=72; CF =72 lies in 60\le t<65: 60+\dfrac{72-66}{10}\times5=60+3=63.0 min.
[4]
(c) At 48 min, within 45\le t<50: \text{CF}=6+\dfrac{48-45}{5}\times14=6+8.4=14.4\approx14 riders.
[3]
(d) Mid-values 42.5,47.5,52.5,57.5,62.5,67.5. \sum fx=42.5(6)+47.5(14)+52.5(26)+57.5(20)+62.5(10)+67.5(4)=255+665+1365+1150+625+270=4330. \bar t=4330/80=54.1 min.
[2]

Final answer

  • (a) 6, 20, 46, 66, 76, 80
  • (b) 53.8 min; 63.0 min
  • (c) 14 riders
  • (d) 54.1 min

Question 24

[12 marks]
An environmental group measures the daily water usage (in litres) of 15 households:
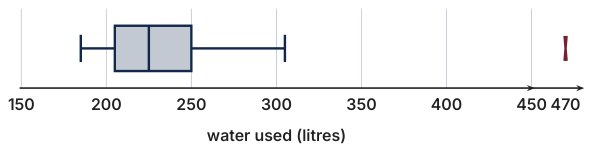
210, 185, 240, 305, 198, 225, 260, 215, 190, 250, 235, 470, 205, 220, 245.
(a) (i) Find the median. (ii) Find Q_1 and Q_3, and hence the interquartile range.
[4]
(b) Using the 1.5\times\text{IQR} rule, identify any outliers.
[3]
(c) The group decides to remove any outliers before reporting. Explain the effect that removing the outlier(s) will have on (i) the mean and (ii) the median, compared with the original data.
[3]
(d) Draw a box-and-whisker diagram of the original 15 values, showing any outlier as a separate point.
[2]
Show solutionHide solution
Ordered: 185 190 198 205 210 215 220 225 235 240 245 250 260 305 470.
(a) (i) Median (8th value) =225 L. (ii) Lower 7: 185 190 198 205 210 215 220, Q_1=205. Upper 7: 235 240 245 250 260 305 470, Q_3=250. \text{IQR}=250-205=45 L.
[4]
(b) Upper boundary =250+1.5(45)=250+67.5=317.5; lower boundary =205-67.5=137.5. Since 470>317.5 it is an outlier; all other values lie within the boundaries. So 470 L is the only outlier.
[3]
(c) (i) The mean will decrease noticeably, because the very large value 470 was pulling the mean up. (ii) The median will change only slightly (it is resistant to outliers), moving down by a small amount as one high value is removed.
[3]
(d) Box Q_1=205 to Q_3=250, median 225; lower whisker to 185; upper whisker to the largest non-outlier 305; outlier 470 marked separately:
Original Photon diagram
[2]

Final answer

  • (a) 225 L; 205 L, 250 L, IQR 45 L
  • (b) 470 L only
  • (c) the mean falls a lot, the median a little
  • (d) whiskers 185 and 305, cross at 470

Question 25

[15 marks]
Two statistics classes, P and Q, each have 12 students. Their marks in the same test are:
Class P: 45, 52, 55, 58, 60, 62, 63, 65, 67, 70, 74, 92
Class Q: 38, 47, 53, 58, 61, 66, 69, 72, 75, 79, 83, 88
(a) For each class, use your GDC to find the mean, the standard deviation \sigma_x, the median and the quartiles.
[4]
(b) Show that class P has exactly one outlier, and that class Q has none.
[4]
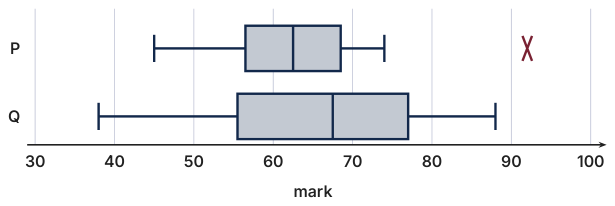
(c) Draw box plots for both classes on the same scale, showing any outlier separately.
[3]
(d) Compare the results of the two classes, referring to a measure of centre and a measure of spread, and say which class you would say did better overall.
[2]
(e) The teacher adds 5 marks to every mark in class Q. Write down the new median and the new interquartile range.
[2]
Show solutionHide solution
(a) Class P: \bar x=63.6, \sigma_x=11.4, median =62.5, Q_1=56.5, Q_3=68.5. A1A1
[2]
Class Q: \bar x=65.8, \sigma_x=14.3, median =67.5, Q_1=55.5, Q_3=77. A1A1
[2]
(b) P: IQR =68.5-56.5=12, so 1.5\times12=18; fences 38.5 and 86.5. M1A1
[2]
92>86.5 is an outlier; the smallest mark 45>38.5 is not.
A1[1]
Q: IQR =77-55.5=21.5, 1.5\times21.5=32.25; fences 23.25 and 109.25; all marks (38 to 88) lie inside, so there is no outlier.
R1[1]
(c) Class P: box 56.5 to 68.5, median 62.5, whiskers to 45 and 74, cross at 92. Class Q: box 55.5 to 77, median 67.5, whiskers to 38 and 88. A1A1A1
[3]
Original Photon diagram
(d) Class Q has the higher median (67.5 against 62.5) and the higher mean, so it did better typically; class P has the smaller IQR (12 against 21.5), so its marks are more consistent. R1R1
[2]
(e) Adding a constant shifts the median but not the spread: new median =72.5, IQR =21.5. A1A1
[2]

Final answer

  • (a) P 63.6, 11.4, 62.5, 56.5, 68.5; Q 65.8, 14.3, 67.5, 55.5, 77
  • (b) P: 92 > 86.5; Q none
  • (c) box plots
  • (d) Q higher median, P more consistent
  • (e) 72.5, 21.5

Question 26

[18 marks]
A bus company in Wales has 2400 regular passengers on one route: 1080 commuters, 840 students and 480 retired passengers.
(a) The company takes a stratified sample of 120 regular passengers. Find the number of students in the sample.
[2]
The table summarises the trip time, t minutes, of each of the 120 sampled passengers.
Time t (min)10\le t<2020\le t<3030\le t<4040\le t<5050\le t<6060\le t<70
Passengers9274128114
(b) Estimate the mean and the standard deviation of the trip times, using mid-interval values.
[3]
(c) Complete the cumulative frequencies at the upper class boundaries.
[1]
Reading the cumulative frequency graph of these times gives a lower quartile of 28 minutes, a median of 36 minutes and an upper quartile of 45 minutes. The quickest trip lasted 12 minutes and the slowest lasted 67 minutes.
(d) Decide, showing your working, whether the longest trip counts as an outlier.
[3]
(e) Draw a box plot of the trip times.
[2]
The fare, in GBP, for a trip of t minutes is 1.80 + 0.12t.
(f) Estimate the mean and the standard deviation of the fares paid by the passengers in the sample.
[3]
(g) Find the greatest possible number of passengers in the sample whose trip took less than 35 minutes.
[2]
(h) The sample was taken only on weekday mornings. Explain how this may affect the estimate of the mean trip time for all regular passengers.
[2]
Show solutionHide solution
(a) \frac{840}{2400}\times120 M1 =42 students A1 (b) Mid-values 15, 25, 35, 45, 55, 65 M1 Mean =\frac{4370}{120}=36.4 minutes (36.417) A1 \sigma=11.9 minutes (11.853) A1 (c) 9, 36, 77, 105, 116, 120 A1 (d) \text{IQR}=45-28=17 M1 Upper fence =45+1.5\times17=70.5 A1 67<70.5, so the longest trip is not an outlier R1 (e) Box from 28 to 45 with median 36; whiskers to 12 and 67 A1A1 (the lower fence is 28-25.5=2.5<12, so there is no low outlier) (f) Mean fare =1.80+0.12(36.4167) M1 = GBP 6.17 A1 Standard deviation =0.12\times11.853= GBP 1.42 A1 (g) Every passenger in 30\le t<40 could have taken less than 35 minutes M1 9+27+41=77 A1 (h) Weekday-morning trips may be busier and slower (or quicker) than trips at other times R1 so the sample may not represent all trips and the estimate of the mean may be biased
R1

Final answer

  • (a) 42
  • (b) 36.4 min, 11.9 min
  • (c) 9, 36, 77, 105, 116, 120
  • (d) fence 70.5: not an outlier
  • (e) box plot
  • (f) GBP 6.17, GBP 1.42
  • (g) 77
  • (h) weekday-morning trips may not represent all trips

Going further

Beyond the syllabus: the worked examples and investigations of the chapter's Going further pages.

G1 One new value

G1 Worked example

[7 marks]
Imke counts the emails she receives in five separate hours: 12, 14, 15, 17, 22.
(a) Find the mean and the variance of the five counts.
[2]
(b) In a sixth hour she receives 16 emails. Find the new mean and the new variance.
[2]
(c) Instead, the sixth hour has 40 emails. Find the new mean, the new median and the new standard deviation.
[3]
Show solutionHide solution
(a) Mean =\frac{80}{5}=16 A1 The deviations are -4,-2,-1,1,6, whose squares add to 58, so the variance is \frac{58}{5}=11.6 A1 (b) The new total is 96, so the mean is \frac{96}{6}=16 A1 The new value has deviation 0, so the sum of squares is still 58 and the variance is \frac{58}{6}=9.67 A1 (c) Mean =\frac{120}{6}=20 A1 Sorted: 12, 14, 15, 17, 22, 40, so the median is \frac{15+17}{2}=16 A1 The deviations from 20 are -8,-6,-5,-3,2,20, with squares adding to 538, so \sigma=\sqrt{\frac{538}{6}}=9.47
A1

Final answer

(a) mean 16, variance 11.6 (b) mean 16, variance 9.67 (c) mean 20, median 16, \sigma=9.47

G2 The variance shortcut

G2 Worked example

[2 marks]
For the list 3, 5, 7, 9, 11, use \sigma^2=\frac{\sum x^2}{n}-\bar{x}^2 to find the variance.
[2]
Show solutionHide solution
\sum x^2=9+25+49+81+121=285 M1 \sigma^2=\frac{285}{5}-7^2=57-49=8
A1

Final answer

\sigma^2=8

G3 Investigation

[15 marks]
Nine students sit a quiz marked out of 60. Their scores are 28, 31, 33, 34, 36, 37, 39, 41, 45.
(a) Find the mean and the standard deviation of the nine scores.
[2]
(b) A tenth student scores 36. Show that the mean is unchanged and that the variance becomes \frac{218}{10}. Find the new standard deviation.
[3]
(c) Show that, for any data set of n values with variance \sigma^2, adding one value equal to the mean gives a variance of \frac{n}{n+1}\sigma^2.
[2]
(d) The tenth student scores v instead. Find v if the mean of the ten scores is 37.
[2]
(e) Find the lower and upper quartiles of the original nine scores. Find the smallest whole-number score v that would be an outlier at the top of the ten scores.
[3]
(f) Find the values of v for which the median of the ten scores is 36.5.
[2]
(g) Explain why the median changes less than the mean when one very large score is added.
[1]
Show solutionHide solution
(a) Total 324, mean 36; \sum(x-36)^2=218 so \sigma^2=\frac{218}{9} and \sigma=4.92 A1A1 (b) New total =324+36=360, mean =36 A1 The new deviation is 0, so the sum of squares stays 218 and the variance is \frac{218}{10}=21.8 A1 \sigma=4.67 A1 (c) The new value has deviation 0 and the mean is unchanged, so \sum(x-\bar{x})^2=n\sigma^2 is unchanged M1 Dividing by n+1 gives \frac{n\sigma^2}{n+1} A1AG (d) 10\times37-324 M1 v=46 A1 (e) The lower four scores 28, 31, 33, 34 have median 32 and the upper four 37, 39, 41, 45 have median 40, so Q_1=32 and Q_3=40 A1 For v\ge45 the ten scores have Q_1=33, Q_3=41 and IQR 8, so the upper fence is 41+12=53 M1 The smallest whole-number outlier is v=54 A1 (f) The 5th and 6th scores are 36 and 37 when v\ge37, so the median is 36.5 exactly when v\ge37 M1A1 (g) The median depends only on the middle values, whereas the mean depends on every value, so one very large score changes the mean far more
R1

Final answer

(a) mean 36, \sigma=4.92 (b) \sigma=4.67 (c) shown (d) v=46 (e) Q_1=32, Q_3=40, v=54 (f) v\ge37 (g) the median depends only on the middle values

From the book

Photon Guidebook: Mathematics Applications and Interpretation SL for the IB Diploma

Chapter 8 teaches describing data from the basics to full exam questions: how the IB asks it, every question type with a marked example, and these practice questions in three steps.

About the book