Free worked solutions · 2026 Edition

IB Maths HL Paper 3 Chapter 17: Practice papers: Applications and interpretation HL worked solutions

Worked solutions to the practice questions in Chapter 17 of Photon Guidebook: Mathematics HL Paper 3 for the IB Diploma (2026 Edition). Each solution shows every step with the mark it earns, the way an IB mark scheme does.

  • Chapter 17 of 18
  • 8 practice questions
  • Free, no sign-up

Bone

Question 1

[27 marks]
Counting steps [27 marks]
This question asks you to test whether a fitness tracker counts steps accurately, and to analyse a runner's training days.
Grace tests a wrist tracker on eight walks of different lengths. For each walk she records the tracker's count and the count from a calibrated reference device.
\begin{array}{|l|r|r|r|r|r|r|r|r|}\hline \text{Walk} & 1 & 2 & 3 & 4 & 5 & 6 & 7 & 8\\\hline \text{Reference} & 5210 & 7340 & 6120 & 8890 & 4560 & 9930 & 7010 & 5880\\\hline \text{Tracker} & 5350 & 7480 & 6200 & 9100 & 4600 & 10\,150 & 7200 & 5990\\\hline\end{array}
(a) Explain why a paired test is appropriate.
[1]
(b) Find the mean and standard deviation of the differences, tracker minus reference.
[2]
(c) Test, at the 1% significance level, whether the tracker overcounts on average.
[5]
(d) Find the equation of the regression line of the tracker count on the reference count.
[2]
(e) The correlation coefficient is very close to 1. Explain why this does not show that the tracker is accurate.
[2]
(f) Use your line to predict the tracker count for a walk of 12 000 reference steps, and comment on the reliability of this prediction.
[2]
(g) Use the gradient of your line to estimate the percentage by which the tracker overcounts long walks.
[1]
Grace's friend Hugo records the day of the week of each of his 105 runs in one year.
\begin{array}{|l|r|r|r|r|r|r|r|}\hline \text{Day} & \text{Mon} & \text{Tue} & \text{Wed} & \text{Thu} & \text{Fri} & \text{Sat} & \text{Sun}\\\hline \text{Runs} & 18 & 12 & 15 & 14 & 11 & 22 & 13\\\hline\end{array}
(h) Test, at the 5% level, whether Hugo's runs are equally likely on each day of the week.
[5]
(i) Explain what a Type I error would mean in (h).
[2]
(j) Hugo claims that he runs more often at weekends. Assuming each run is independently on a weekend day with probability \frac{2}{7}, test his claim at the 5% level.
[3]
(k) Give one reason why the runs may not be independent.
[2]
Show solutionHide solution
(a) each walk gives two counts of the same steps, so the tracker and reference counts are matched pairs, not independent samples [R1]
(b) differences, tracker - reference: 140\,140,80\,210,40\,220\,190\,110; \bar d=\frac{1130}{8}=141.25 steps [A1]
sample standard deviation s=63.6 steps [A1]
(c) \mathrm{H}_0\colon\mu_d=0, \mathrm{H}_1\colon\mu_d>0, where \mu_d is the mean of tracker - reference, in steps, over all walks [A1]
paired t-test: a one-sample t-test on the eight differences [M1]
t=6.28 [A1]
p=0.000205 [A1]
0.000205<0.01: reject \mathrm{H}_0; there is evidence at the 1% level that the tracker overcounts steps on average [R1]
(d) T=1.03R-64.6 [A1 A1]
(e) r measures how closely the points lie on a straight line, not whether the two counts agree [R1]
a tracker that always reads about 3% high would still give r\approx1 although every count is wrong; accuracy needs the differences to be near 0, that is the line T=R [R1]
(f) 1.03(12\,000)-64.6\approx12\,300 steps [A1]
12 000 is outside the range of the data (4560 to 9930), so this is extrapolation and may be unreliable [R1]
(g) the gradient 1.03 means about 3% more tracker steps for each reference step, so about 3% on long walks [A1]
(h) \mathrm{H}_0: runs are equally likely on each day of the week; \mathrm{H}_1: they are not equally likely [A1]
expected frequency \frac{105}{7}=15 for each day; \chi^2 goodness of fit test with \mathrm{df}=7-1=6 [M1]
\chi^2=5.87 [A1]
p=0.438 [A1]
0.438>0.05: do not reject \mathrm{H}_0; there is no evidence that Hugo's runs are unevenly spread over the days [R1]
(i) a Type I error would be concluding that Hugo's runs are not equally likely on the seven days [R1]
when in fact each day is equally likely (the chance of this is the significance level, 0.05) [R1]
(j) 35 runs are on Saturday or Sunday; under \mathrm{H}_0\colon p=\frac27, X\sim\mathrm{B}\left(105,\frac27\right) and \mathrm{H}_1\colon p>\frac27; find \mathrm{P}(X\ge35) [M1]
\mathrm{P}(X\ge35)=0.165 [A1]
0.165>0.05: there is not enough evidence that Hugo runs more often at weekends [R1]
(k) for example, a long weekend run may be followed by rest days, so the day of one run depends on the day of the previous one [R1]
so the runs are not independent and a fixed probability \frac27 for every run does not hold [R1]

Final answer

  • (b) 141.25, 63.6
  • (c) t=6.28, p=0.000205, reject
  • (d) T=1.03R-64.6
  • (f) 12 300
  • (g) 3%
  • (h) \chi^2=5.87, p=0.438
  • (j) p=0.165.

Question 2

[28 marks]
A weed in the lake [28 marks]
This question asks you to model an invasive weed in a lake when some of it is removed every day.
The area of a lake covered by a weed is A m^2, where t is the time in days. Without removal, \dfrac{\mathrm{d}A}{\mathrm{d}t}=0.2A\left(1-\dfrac{A}{500}\right). A team removes h m^2 of weed per day, so that \dfrac{\mathrm{d}A}{\mathrm{d}t}=0.2A\left(1-\dfrac{A}{500}\right)-h.
(a) Interpret the values 0.2 and 500 in context.
[2]
(b) For h=0, find the equilibrium values of A and state whether each is stable.
[3]
(c) For h=16, show that the equilibria are A=100 and A=400.
[3]
(d) For h=16, determine the stability of each equilibrium, and sketch a phase line.
[3]
(e) For h=16 and A=150 when t=0, use Euler's method with a step of 1 day to estimate A when t=3.
[3]
(f) Describe the long-term behaviour when h=16 for an initial area of 150 m^2 and for an initial area of 80 m^2.
[3]
(g) Find the greatest daily removal h for which the equation has an equilibrium, and interpret your answer.
[4]
(h) For h=30, show that \dfrac{\mathrm{d}A}{\mathrm{d}t}<0 for all A, and use your GDC to find the time taken for the weed to disappear from an initial area of 400 m^2.
[4]
(i) Give two criticisms of the model.
[3]
Show solutionHide solution
(a) when the area is small, the weed grows by about 0.2 of its area each day, that is 20% per day [R1]
500\ \mathrm{m^2} is the largest area the lake can support: with no removal, growth stops there [R1]
(b) 0.2A\left(1-\frac{A}{500}\right)=0 (\frac{\mathrm{d}A}{\mathrm{d}t}=0) [M1]
A=0 and A=500 [A1]
for 0<A<500, \frac{\mathrm{d}A}{\mathrm{d}t}>0, so A moves away from 0 and towards 500: A=0 is unstable, A=500 is stable [R1]
(c) 0.2A\left(1-\frac{A}{500}\right)-16=0, so 0.2A-0.0004A^2-16=0 [M1]
A^2-500A+40\,000=0 [A1]
(A-100)(A-400)=0 [A1]
A=100 or A=400 [AG]
(d) \frac{\mathrm{d}A}{\mathrm{d}t}=-\frac{(A-100)(A-400)}{2500} is negative for A<100, positive for 100<A<400 and negative for A>400 [M1]
A=100 is unstable; A=400 is stable [A1]
phase line with equilibria at 100 and 400: arrows away from 100 and towards 400 from both sides (see the figure) [A1]
(e) A_{n+1}=A_n+1\times\left[0.2A_n\left(1-\frac{A_n}{500}\right)-16\right], A_0=150 [M1]
A_1=155, A_2=160.39 [A1]
A_3=166.18\approx166\ \mathrm{m^2} [A1]
(f) from 150 (between 100 and 400), \frac{\mathrm{d}A}{\mathrm{d}t}>0, so A increases and tends to 400\ \mathrm{m^2} [A1]
from 80 (below 100), \frac{\mathrm{d}A}{\mathrm{d}t}<0, so A decreases and the weed is removed completely [A1]
the outcome depends on which side of 100\ \mathrm{m^2} the starting area lies: 100 is a tipping point [R1]
(g) equilibria exist when h=0.2A-0.0004A^2 has a solution [M1]
\frac{\mathrm{d}}{\mathrm{d}A}\left(0.2A-0.0004A^2\right)=0 gives A=250 [A1]
h=0.2(250)-0.0004(250)^2=25\ \mathrm{m^2} per day [A1]
for h>25 the weed cannot be held at a constant area and is cleared whatever the starting area; 25\ \mathrm{m^2} per day is the fastest the weed can regrow [R1]
(h) the quadratic -0.0004A^2+0.2A-30 has discriminant 0.2^2-4(0.0004)(30)=-0.008<0 [M1]
so there are no real roots and, with a negative leading coefficient, \frac{\mathrm{d}A}{\mathrm{d}t}<0 for all A [R1]
time =\int_0^{400}\frac{\mathrm{d}A}{30-0.2A+0.0004A^2} [M1]
46.5 days [A1]
(i) a fixed removal of h cannot continue when A<h: the model gives negative areas as the weed disappears [R1]
the rate 0.2 and the capacity 500 are fixed, but real growth changes with the season, light and temperature [R1]
a stated effect on a prediction, for example slower growth in winter would clear the lake sooner than predicted in (h) [R1]

Final answer

  • (b) 0 unstable, 500 stable
  • (d) 100 unstable, 400 stable
  • (e) 166
  • (f) tends to 400; weed cleared
  • (g) h=25
  • (h) 46.5 days.

Btwo

Question 3

[26 marks]
Inside a museum [26 marks]
This question asks you to plan routes through a museum's corridors and between its exhibits.
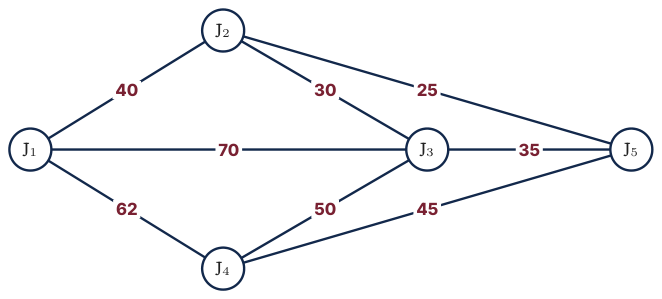
The corridors of a museum join five junctions, \mathrm{J}_1 to \mathrm{J}_5. The diagram shows the corridors and their lengths, in metres.
Original Photon diagram
(a) Find the total length of the corridors.
[1]
(b) Find the degree of each junction, and explain why a cleaner who walks every corridor and returns to the start must repeat some corridors.
[2]
(c) Find the shortest distance between each pair of junctions of odd degree.
[3]
(d) Find the length of the shortest closed route that walks every corridor at least once.
[4]
(e) A security guard may start and finish at different junctions. State where she should start and finish, and the length of her shortest route.
[3]
Five exhibits P, Q, R, S and T are to be visited in one tour that returns to its start. The walking times between them, in minutes, are in the table.
\begin{array}{|c|r|r|r|r|r|}\hline & \mathrm{P} & \mathrm{Q} & \mathrm{R} & \mathrm{S} & \mathrm{T}\\\hline \mathrm{P} & - & 8 & 12 & 10 & 15\\\hline \mathrm{Q} & 8 & - & 7 & 13 & 9\\\hline \mathrm{R} & 12 & 7 & - & 6 & 11\\\hline \mathrm{S} & 10 & 13 & 6 & - & 5\\\hline \mathrm{T} & 15 & 9 & 11 & 5 & -\\\hline\end{array}
(f) Use the nearest neighbour algorithm starting at P to find an upper bound for the tour.
[3]
(g) By deleting P, find a lower bound for the tour.
[3]
(h) Find a tour that is shorter than the one in (f).
[2]
(i) Write down the adjacency matrix of the corridor network, and find the number of walks of length 2 from \mathrm{J}_1 to \mathrm{J}_5.
[3]
(j) Suggest one reason why the shortest route in (d) may not be used by the cleaner.
[2]
Show solutionHide solution
(a) 40+30+50+62+70+25+45+35=357\ \mathrm{m} [A1]
(b) degrees: \mathrm{J}_1\colon3, \mathrm{J}_2\colon3, \mathrm{J}_3\colon4, \mathrm{J}_4\colon3, \mathrm{J}_5\colon3 [A1]
four junctions have odd degree, so no closed route uses every corridor exactly once: some corridors are walked twice [R1]
(c) odd junctions \mathrm{J}_1, \mathrm{J}_2, \mathrm{J}_4, \mathrm{J}_5; six pairs, with routes through other junctions where shorter [M1]
\mathrm{J}_1\mathrm{J}_2=40, \mathrm{J}_2\mathrm{J}_5=25, \mathrm{J}_4\mathrm{J}_5=45, \mathrm{J}_1\mathrm{J}_4=62 [A1]
\mathrm{J}_1\mathrm{J}_5=65 (via \mathrm{J}_2), \mathrm{J}_2\mathrm{J}_4=70 (via \mathrm{J}_5) [A1]
(d) three ways to pair the four odd junctions [M1]
\mathrm{J}_1\mathrm{J}_2+\mathrm{J}_4\mathrm{J}_5=85; \ \mathrm{J}_1\mathrm{J}_4+\mathrm{J}_2\mathrm{J}_5=87; \ \mathrm{J}_1\mathrm{J}_5+\mathrm{J}_2\mathrm{J}_4=135 [A1]
the least extra distance is 85\ \mathrm{m}: repeat \mathrm{J}_1\mathrm{J}_2 and \mathrm{J}_4\mathrm{J}_5 [A1]
357+85=442\ \mathrm{m} [A1]
(e) she starts and finishes at two odd junctions, so only the shortest path between the other two is repeated: \mathrm{J}_2\mathrm{J}_5=25\ \mathrm{m} [R1]
start at \mathrm{J}_1 and finish at \mathrm{J}_4 (or the reverse) [A1]
357+25=382\ \mathrm{m} [A1]
(f) nearest neighbour from P: choose the shortest edge to an unvisited exhibit each time [M1]
route \mathrm{PQRSTP} with times 8,7,6,5,15 [A1]
upper bound 8+7+6+5+15=41 minutes [A1]
(g) delete P: minimum spanning tree of Q, R, S, T uses \mathrm{ST}=5, \mathrm{RS}=6, \mathrm{QR}=7 [M1]
total of the tree: 18 [A1]
add the two shortest edges at P, \mathrm{PQ}=8 and \mathrm{PS}=10: lower bound 36 minutes [A1]
(h) a tour that visits each exhibit once and returns to P, other than \mathrm{PQRSTP} [M1]
\mathrm{PQTSRP}=8+9+5+6+12=40 minutes [A1]
(i) adjacency matrix, with rows and columns in the order \mathrm{J}_1 to \mathrm{J}_5 []
\left(\begin{array}{ccccc}0&1&1&1&0\\1&0&1&0&1\\1&1&0&1&1\\1&0&1&0&1\\0&1&1&1&0\end{array}\right) [A1]
walks of length 2 from \mathrm{J}_1 to \mathrm{J}_5: entry (1,5) of the matrix squared, or a count of \mathrm{J}_1\to\mathrm{J}_k\to\mathrm{J}_5 [M1]
3 walks, through \mathrm{J}_2, \mathrm{J}_3 and \mathrm{J}_4 [A1]
(j) corridor length is not the same as time or effort, for example stairs, crowds or a gallery closed to cleaners [R1]
so the route of least length need not be the route of least cleaning time; times, or only the open corridors, should be used [R1]

Final answer

  • (a) 357 m
  • (b) 3,3,4,3,3
  • (d) 442 m
  • (e) \mathrm{J}_1 to \mathrm{J}_4, 382 m
  • (f) 41
  • (g) 36
  • (h) 40
  • (i) 3.

Question 4

[29 marks]
Mould on a dish [29 marks]
This question asks you to fit two growth models to the area of a mould colony and to use one of them as a differential equation.
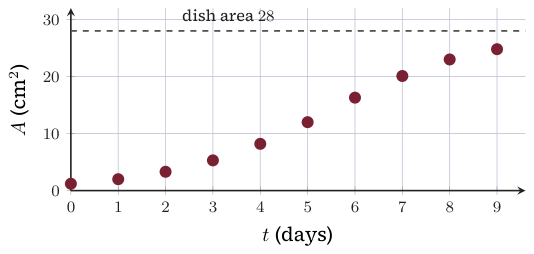
Lucía measures the area A cm^2 of a mould colony on a dish of area 28 cm^2 each day, where t is in days.
\begin{array}{|c|r|r|r|r|c|r|r|r|r|r|}\hline t & 0 & 1 & 2 & 3 & 4 & 5 & 6 & 7 & 8 & 9\\\hline A & 1.2 & 2.0 & 3.3 & 5.3 & 8.2 & 12.0 & 16.3 & 20.1 & 23.0 & 24.8\\\hline\end{array}
Original Photon diagram
(a) Describe the growth and explain why an exponential model may suit the first few days.
[2]
(b) Using the first five readings, find the least-squares line of \ln A against t, and hence a model A=A_0e^{kt}.
[3]
(c) Find the doubling time given by this model.
[2]
(d) Use the model to predict the area at t=9, and comment.
[2]
Lucía now uses the model A=\dfrac{28}{1+ae^{-bt}}.
(e) Show that \ln\left(\dfrac{28}{A}-1\right)=\ln a-bt.
[3]
(f) Using all ten readings, find a and b.
[4]
(g) Find the sum of squared residuals for the logistic model and for the exponential model of (b) over all ten readings, and comment.
[3]
(h) Find the time at which the colony grows fastest, and the rate of growth then.
[4]
(i) Show that the logistic model satisfies \dfrac{\mathrm{d}A}{\mathrm{d}t}=bA\left(1-\dfrac{A}{28}\right).
[4]
(j) Give one reason why the model may fail after day 9.
[2]
Show solutionHide solution
(a) slow at first, then faster, then levelling off near 25\ \mathrm{cm^2} as the colony nears the edge of the dish [A1]
in the first days the area is multiplied by about 1.6 each day (\frac{2.0}{1.2}, \frac{3.3}{2.0}, \frac{5.3}{3.3}), which is exponential growth: food and space are not yet limiting [R1]
(b) \ln A for t=0,\dots,4: 0.182, 0.693, 1.194, 1.668, 2.104, and a regression line [M1]
\ln A=0.205+0.482t [A1]
A=e^{0.205}e^{0.482t}=1.23e^{0.482t} [A1]
(c) 2=e^{0.482T}, so T=\frac{\ln2}{0.482} [M1]
T=1.44 days [A1]
(d) A(9)=1.23e^{0.482\times9}=93.8\ \mathrm{cm^2} [A1]
this is far more than the dish area, 28\ \mathrm{cm^2} (and the reading 24.8): the exponential model fails at later times [R1]
(e) A=\frac{28}{1+ae^{-bt}} gives \frac{28}{A}=1+ae^{-bt} [M1]
\frac{28}{A}-1=ae^{-bt} [M1]
\ln\left(\frac{28}{A}-1\right)=\ln a+\ln e^{-bt} [A1]
\ln\left(\frac{28}{A}-1\right)=\ln a-bt [AG]
(f) z=\ln\left(\frac{28}{A}-1\right) for all ten readings: 3.11, 2.56, 2.01, 1.45, 0.88, 0.29, −0.33, −0.93, −1.53, −2.05 [M1]
z=3.16-0.580t [A1]
b=0.580 [A1]
a=e^{3.16}=23.5 [A1]
(g) logistic model: sum of squared residuals 0.214 [A1]
exponential model of (b): sum of squared residuals 6260 [A1]
the logistic model fits far better, because its sum of squares is much smaller; the exponential model cannot level off [R1]
(h) growth is fastest at the point of inflexion, where A=\frac{28}{2}=14 [M1]
\frac{28}{1+23.5e^{-0.580t}}=14 gives 23.5e^{-0.580t}=1 [M1]
t=\frac{\ln23.5}{0.580}=5.44 days [A1]
\frac{\mathrm{d}A}{\mathrm{d}t}=0.580\times14\times\left(1-\frac{14}{28}\right)=4.06\ \mathrm{cm^2} per day [A1]
(i) A=28\left(1+ae^{-bt}\right)^{-1}, so \frac{\mathrm{d}A}{\mathrm{d}t}=-28\left(1+ae^{-bt}\right)^{-2}\times\left(-abe^{-bt}\right) [M1]
\frac{\mathrm{d}A}{\mathrm{d}t}=\frac{28abe^{-bt}}{\left(1+ae^{-bt}\right)^2} [A1]
1-\frac{A}{28}=1-\frac{1}{1+ae^{-bt}}=\frac{ae^{-bt}}{1+ae^{-bt}} [M1]
bA\left(1-\frac{A}{28}\right)=b\times\frac{28}{1+ae^{-bt}}\times\frac{ae^{-bt}}{1+ae^{-bt}}=\frac{\mathrm{d}A}{\mathrm{d}t} [A1]
\frac{\mathrm{d}A}{\mathrm{d}t}=bA\left(1-\frac{A}{28}\right) [AG]
(j) food or space may run out, or waste may build up, so the colony could shrink [R1]
the model has a fixed ceiling and never decreases, so it cannot describe a colony that dies back [R1]

Final answer

  • (b) A=1.23e^{0.482t}
  • (c) 1.44 days
  • (d) 93.8
  • (f) a=23.5, b=0.580
  • (g) 0.214, 6260
  • (h) 5.44 days, 4.06 cm^2 per day.

Bthree

Question 5

[25 marks]
Classes at a gym [25 marks]
This question asks you to model how gym members switch classes, and then to test whether class choice is linked to age.
Each week, each of 160 gym members attends one class: yoga (Y), spin (S) or Pilates (P). Of those who do yoga one week, 60% do yoga, 30% spin and 10% Pilates the next week. Of those who spin, 20% move to yoga, 50% spin and 30% move to Pilates. Of those who do Pilates, 10% move to yoga, 30% to spin and 60% stay.
(a) Write down the transition matrix, with columns for this week and rows for next week.
[2]
(b) This week 50 members do yoga, 62 spin and 48 Pilates. Find the expected numbers for each class next week and the week after.
[3]
(c) Find the eigenvalues of the transition matrix.
[3]
(d) Find the long-term expected number of members in each class.
[3]
(e) Find the probability that a member who does yoga this week does yoga three weeks later.
[2]
(f) Explain, using the eigenvalues, why the long-term numbers do not depend on this week's numbers.
[2]
A separate survey of 150 members records class and age group.
\begin{array}{|l|c|c|}\hline & \text{Under 30} & \text{30 or over}\\\hline \text{Yoga} & 18 & 32\\\hline \text{Spin} & 40 & 22\\\hline \text{Pilates} & 12 & 26\\\hline\end{array}
(g) Test, at the 5% significance level, whether class choice is independent of age group.
[5]
(h) Identify the class whose observed counts differ most from those expected, and interpret this.
[3]
(i) Give one reason why the Markov model may not hold for the gym.
[2]
Show solutionHide solution
(a) \mathbf{T}=\left(\begin{array}{ccc}0.6&0.2&0.1\\0.3&0.5&0.3\\0.1&0.3&0.6\end{array}\right), columns Y, S, P [A1 A1]
(b) \mathbf{T}\left(\begin{array}{c}50\\62\\48\end{array}\right) [M1]
next week: 47.2 yoga, 60.4 spin, 52.4 Pilates [A1]
the week after: 45.6 yoga, 60.1 spin, 54.3 Pilates [A1]
(c) \det(\mathbf{T}-\lambda\mathbf{I})=0, or a GDC eigenvalue calculation [M1]
\lambda=1 and \lambda=0.5 [A1]
\lambda=0.2 [A1]
(d) the long-term state \mathbf{v} satisfies \mathbf{T}\mathbf{v}=\mathbf{v} with total 160 [M1]
proportions \frac{11}{40}, \frac38, \frac{7}{20} (0.275, 0.375, 0.35) [A1]
44 yoga, 60 spin, 56 Pilates [A1]
(e) the entry in row Y, column Y of \mathbf{T}^3 [M1]
0.351 [A1]
(f) the other eigenvalues, 0.5 and 0.2, have size less than 1, so their contributions to \mathbf{T}^n\mathbf{s} shrink to 0 as n grows [R1]
only the part belonging to \lambda=1 remains: a fixed vector whose size is set by the total of 160 members, not by how they were split this week [R1]
(g) \mathrm{H}_0: class and age group are independent; \mathrm{H}_1: they are not independent [A1]
expected counts \frac{\text{row total}\times\text{column total}}{150}: 23.3,\ 26.7,\ 28.9,\ 33.1,\ 17.7,\ 20.3; \mathrm{df}=(3-1)(2-1)=2 [M1]
\chi^2=13.7 [A1]
p=0.00106 [A1]
0.00106<0.05: reject \mathrm{H}_0; there is evidence that choice of class depends on age group [R1]
(h) contributions \frac{(O-E)^2}{E} for each cell, or a comparison of O and E [M1]
spin: the largest difference, with 40 under-30s against 28.9 expected (contributions 4.23 and 3.70) [A1]
younger members choose spin more often than independence predicts, and older members less often [R1]
(i) members may change class for reasons other than last week's class, for example the timetable, friends or the season [R1]
so the transition probabilities are not constant, or depend on more than one week, or the membership of 160 changes: the model's predictions would be wrong [R1]

Final answer

  • (b) (47.2,\,60.4,\,52.4), (45.6,\,60.1,\,54.3)
  • (c) 1,\ 0.5,\ 0.2
  • (d) 44,\ 60,\ 56
  • (e) 0.351
  • (g) \chi^2=13.7, p=0.00106
  • (h) spin.

Question 6

[30 marks]
A zip-line [30 marks]
This question asks you to use vectors and calculus to describe a ride on a zip-line and to redesign its landing tower.
Relative to the foot of the launch tower, with distances in metres and the z-axis vertical, a straight zip-line cable runs from \mathrm{A}(0,0,25) to \mathrm{B}(120,50,5).
(a) Find \overrightarrow{\mathrm{AB}} and the length of the cable.
[3]
(b) Find the angle that the cable makes with the horizontal.
[3]
(c) Write down a vector equation of the line of the cable.
[2]
A rider's speed, in \mathrm{m\,s^{-1}}, t seconds after leaving A is modelled by v=2t-0.08t^2.
(d) Find the maximum speed and when it occurs.
[3]
(e) Find the distance travelled along the cable after t seconds, and the time taken to reach B.
[4]
(f) Find the position vector of the rider when t=10.
[3]
(g) The top of a tree is at \mathrm{T}(60,40,10). Find the point of the cable closest to T, and the shortest distance from the cable to T.
[5]
A new landing tower is to be built 130 m horizontally from the launch tower, with landing height h m. The cable slopes downwards from A and, for safety, must make an angle of at most 10^\circ with the horizontal. The cost of the cable is 50 dollars per metre and the cost of the landing tower is 300 dollars per metre of height.
(h) Find the least value of h allowed, write down the total cost C(h), and find the value of h that minimises the cost.
[5]
(i) Give one reason why the straight-line model of the cable is a simplification.
[2]
Show solutionHide solution
(a) \overrightarrow{\mathrm{AB}}=\left(\begin{array}{c}120\\50\\5-25\end{array}\right) [M1]
\overrightarrow{\mathrm{AB}}=\left(\begin{array}{c}120\\50\\-20\end{array}\right) [A1]
\left|\overrightarrow{\mathrm{AB}}\right|=\sqrt{120^2+50^2+20^2}=\sqrt{17\,300}=132\ \mathrm{m} [A1]
(b) horizontal distance \sqrt{120^2+50^2}=130 and drop 20 [M1]
\tan\theta=\frac{20}{130} [A1]
\theta=8.75^\circ [A1]
(c) \mathbf{r}=\left(\begin{array}{c}0\\0\\25\end{array}\right)+\lambda\left(\begin{array}{c}120\\50\\-20\end{array}\right) [A1 A1]
(d) \frac{\mathrm{d}v}{\mathrm{d}t}=2-0.16t=0 [M1]
t=12.5\ \mathrm{s} [A1]
v_{\max}=2(12.5)-0.08(12.5)^2=12.5\ \mathrm{m\,s^{-1}} [A1]
(e) s=\int_0^t\left(2u-0.08u^2\right)\mathrm{d}u [M1]
s=t^2-\frac{0.08}{3}t^3 [A1]
t^2-\frac{0.08}{3}t^3=131.5 [M1]
t=14.7\ \mathrm{s} [A1]
(f) s(10)=100-\frac{80}{3}=73.3\ \mathrm{m} [M1]
the rider is a fraction \frac{73.33}{131.5}=0.558 of the way along \overrightarrow{\mathrm{AB}}: position \left(\begin{array}{c}0\\0\\25\end{array}\right)+0.558\left(\begin{array}{c}120\\50\\-20\end{array}\right) [M1]
\left(\begin{array}{c}66.9\\27.9\\13.8\end{array}\right) [A1]
(g) \overrightarrow{\mathrm{AT}}=\left(\begin{array}{c}60\\40\\-15\end{array}\right); the closest point P satisfies \overrightarrow{\mathrm{PT}}\cdot\overrightarrow{\mathrm{AB}}=0, where \overrightarrow{\mathrm{AP}}=\lambda\overrightarrow{\mathrm{AB}} [M1]
(60-120\lambda)120+(40-50\lambda)50+(-15+20\lambda)(-20)=0, so 9500-17\,300\lambda=0 and \lambda=\frac{95}{173} [A1]
\mathrm{P}=(65.9,\ 27.5,\ 14.0) [A1]
\left|\overrightarrow{\mathrm{PT}}\right|=\sqrt{(-5.9)^2+12.5^2+(-4.0)^2} [M1]
14.4\ \mathrm{m} [A1]
(h) the drop is 25-h over a horizontal distance of 130: \tan10^\circ\ge\frac{25-h}{130} [M1]
h\ge25-130\tan10^\circ=2.08\ \mathrm{m} [A1]
C(h)=50\sqrt{130^2+(25-h)^2}+300h [A1]
C'(h)=300-\frac{50(25-h)}{\sqrt{130^2+(25-h)^2}} [M1]
\frac{|25-h|}{\sqrt{130^2+(25-h)^2}}<1, so C'(h)>250>0: C is increasing and the cost is least at the smallest allowed value, h=2.08\ \mathrm{m} [R1]
(i) a loaded cable sags under its own weight and the rider's, so the path is a curve, not a straight line [R1]
so the true length, the angle and the clearance of the tree at T differ from the values found [R1]

Final answer

  • (a) (120,\,50,\,-20), 132 m
  • (b) 8.75^\circ
  • (d) 12.5\ \mathrm{m\,s^{-1}} at t=12.5\ \mathrm{s}
  • (e) 14.7\ \mathrm{s}
  • (f) (66.9,\,27.9,\,13.8)
  • (g) (65.9,\,27.5,\,14.0), 14.4 m
  • (h) h=2.08.

Bfour

Question 7

[27 marks]
A drug in the body [27 marks]
This question asks you to model how a drug moves between the blood and the body tissue, and to describe the long-term behaviour of the amounts.
A patient is given a drug. At time t hours, x mg of the drug is in the blood and y mg is in the tissue, where
\frac{\mathrm{d}x}{\mathrm{d}t}=-0.4x+0.1y,\qquad \frac{\mathrm{d}y}{\mathrm{d}t}=0.3x-0.2y.
At t=0, x=50 and y=0.
(a) Interpret the terms 0.3x and 0.1y in context.
[2]
(b) Use Euler's method with a step of 0.5 hours to estimate x and y when t=1.
[3]
(c) Find the eigenvalues, and a corresponding eigenvector for each, of the matrix of coefficients of the system.
[4]
(d) Classify the equilibrium point at the origin, giving a reason.
[2]
(e) Find the solution of the system that satisfies x=50, y=0 when t=0.
[4]
(f) Sketch the phase portrait, showing the directions of the eigenvectors and the trajectory that starts at (50,0).
[4]
(g) Find the time at which the amount of drug in the tissue is greatest, and find this greatest amount.
[3]
(h) Compare your estimates in (b) with the exact values at t=1, and suggest how the estimates could be improved.
[3]
(i) Show that \dfrac{y}{x}\to3 as t\to\infty, and interpret this in context.
[2]
Show solutionHide solution
(a) 0.3x is the rate at which drug moves from the blood to the tissue: 30% of the amount in the blood each hour [R1]
0.1y is the rate at which drug returns from the tissue to the blood: 10% of the amount in the tissue each hour [R1]
(b) x_{n+1}=x_n+0.5(-0.4x_n+0.1y_n), y_{n+1}=y_n+0.5(0.3x_n-0.2y_n) [M1]
t=0.5: x=40, y=7.5 [A1]
t=1: x=32.375\approx32.4, y=12.75\approx12.8 (mg) [A1]
(c) \det\left(\begin{array}{cc}-0.4-\lambda&0.1\\0.3&-0.2-\lambda\end{array}\right)=0, so \lambda^2+0.6\lambda+0.05=0 [M1]
\lambda=-0.1 and \lambda=-0.5 [A1]
for \lambda=-0.1: \left(\begin{array}{c}1\\3\end{array}\right) [A1]
for \lambda=-0.5: \left(\begin{array}{c}1\\-1\end{array}\right) [A1]
(d) a stable node [A1]
both eigenvalues are real and negative, so every trajectory approaches the origin without spiralling [R1]
(e) \left(\begin{array}{c}x\\y\end{array}\right)=Ae^{-0.1t}\left(\begin{array}{c}1\\3\end{array}\right)+Be^{-0.5t}\left(\begin{array}{c}1\\-1\end{array}\right) [M1]
x=Ae^{-0.1t}+Be^{-0.5t}, y=3Ae^{-0.1t}-Be^{-0.5t} [A1]
A+B=50, 3A-B=0 [M1]
A=12.5, B=37.5: x=12.5e^{-0.1t}+37.5e^{-0.5t}, y=37.5e^{-0.1t}-37.5e^{-0.5t} [A1]
(f) origin a node; dashed lines y=3x and y=-x drawn through it (see the figure) [A1]
arrows towards the origin on both lines [A1]
other trajectories curve and become tangent to y=3x near the origin [A1]
the trajectory from (50,0) leaves upwards and to the left, then bends towards the origin along y=3x [A1]
(g) \frac{\mathrm{d}y}{\mathrm{d}t}=-3.75e^{-0.1t}+18.75e^{-0.5t}=0, so e^{0.4t}=5 [M1]
t=\frac{\ln5}{0.4}=4.02 hours [A1]
y=37.5\left(e^{-0.402}-e^{-2.01}\right)=20.1 mg [A1]
(h) exact values at t=1: x=34.1, y=11.2 [A1]
the estimates are 1.7 mg too small for x and 1.6 mg too large for y [A1]
Euler's method uses the slope at the start of each step: a smaller step, or a better method, reduces the error [R1]
(i) \frac{y}{x}=\frac{37.5-37.5e^{-0.4t}}{12.5+37.5e^{-0.4t}}, dividing numerator and denominator by e^{-0.1t} [M1]
as t\to\infty, e^{-0.4t}\to0 so \frac{y}{x}\to\frac{37.5}{12.5}=3: both amounts fall to 0, but eventually the tissue holds three times as much drug as the blood [R1]

Final answer

  • (b) x\approx32.4, y\approx12.8
  • (c) -0.1,\ (1,3) and -0.5,\ (1,-1)
  • (d) stable node
  • (e) x=12.5e^{-0.1t}+37.5e^{-0.5t}, y=37.5e^{-0.1t}-37.5e^{-0.5t}
  • (g) 4.02 h, 20.1 mg
  • (h) 34.1, 11.2
  • (i) the ratio tends to 3.

Question 8

[28 marks]
Drone bases [28 marks]
This question asks you to locate emergency drone bases and to measure how clear-cut the choice of base is at different points.
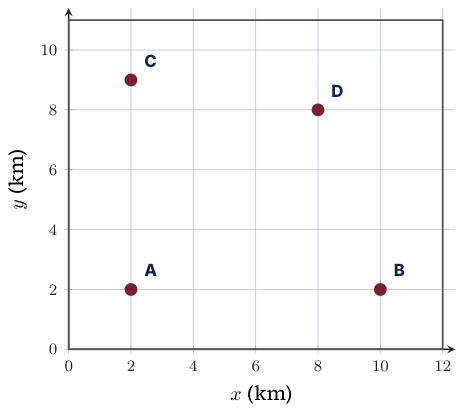
Four drone bases \mathrm{A}(2,2), \mathrm{B}(10,2), \mathrm{C}(2,9) and \mathrm{D}(8,8) serve a rectangular county 0\le x\le12, 0\le y\le11, with distances in kilometres. Each call is answered by a drone from the nearest base. The bases are shown in the diagram.
Original Photon diagram
(a) Find the equation of the line of points that are equidistant from A and D.
[3]
(b) Show that the point (6,4) is equidistant from A, B and D, and find this distance.
[3]
(c) Find the coordinates of the point that is equidistant from A, C and D.
[4]
(d) On a copy of the diagram, draw the Voronoi diagram for the four bases inside the county, marking its vertices.
[3]
For a point P in the county, let d_1 and d_2 be the distances from P to its nearest and second nearest bases. The margin of P is m(\mathrm{P})=d_2-d_1 kilometres.
(e) Find the margin of the point (6,8).
[3]
(f) Explain why m(\mathrm{P})=0 for every point P on an edge of the Voronoi diagram.
[2]
(g) For points (x,2) with 3\le x\le6, show that m=12-2x, and find the point on this line at which the margin is 4.
[4]
(h) A fifth base is to be built at the point of the county that is furthest from its nearest existing base. You may assume that this point is one of the two Voronoi vertices or one of the four corners of the county. Find the point and its distance from the nearest existing base.
[4]
(i) Give one reason why the Voronoi diagram may not show the true response areas.
[2]
Show solutionHide solution
(a) midpoint of AD is (5,5) [A1]
gradient of AD is 1, so the required line has gradient −1 [M1]
y-5=-(x-5), that is x+y=10 [A1]
(b) squared distances from (6,4): to A 4^2+2^2, to B 4^2+2^2, to D 2^2+4^2 [M1]
all equal to 20 [A1]
distance \sqrt{20}=2\sqrt5=4.47 km [A1]
(c) points equidistant from A and C lie on y=5.5 [M1]
the horizontal line through (2,5.5) [A1]
solve with x+y=10 from (a) [M1]
(4.5,\ 5.5) [A1]
(d) vertices marked at (6,4) and (4.5,5.5) (see the figure) [A1]
at least three edges correct [A1]
all five edges correct, each ending at a vertex or on the boundary [A1]
(e) distances from (6,8): A \sqrt{52}=7.21, B \sqrt{52}=7.21, C \sqrt{17}=4.12, D 2 [M1]
d_1=2 (D) and d_2=4.12 (C) [A1]
m=4.12-2=2.12 km [A1]
(f) a point on an edge is equidistant from the two bases that share that edge [R1]
no other base is closer, so these two are the nearest and second nearest, d_1=d_2 and m=0 [R1]
(g) for 3\le x\le6 the nearest base is A, with d_1=x-2, and the second nearest is B, with d_2=10-x [M1]
compare with C and D: 10-x<\sqrt{(x-2)^2+49} for x>2.94, and 10-x<\sqrt{(8-x)^2+36} for x>0 [R1]
m=(10-x)-(x-2)=12-2x [AG]
12-2x=4 [M1]
x=4: the point (4,2) [A1]
(h) distances to the nearest base for each candidate point [M1]
vertices: (6,4)\colon\sqrt{20}=4.47; (4.5,5.5)\colon\sqrt{18.5}=4.30 [A1]
corners: (0,0),(12,0),(0,11)\colon\sqrt8=2.83 each; (12,11)\colon5 (from D) [A1]
the greatest is at the corner (12,11), 5.00 km from D [A1]
(i) drones fly in straight lines but roads, no-fly zones or terrain may make the nearest base by distance slower than another [R1]
or the nearest base may already be busy, so the diagram shows distance, not response time [R1]

Final answer

  • (a) x+y=10
  • (b) 2\sqrt5=4.47 km
  • (c) (4.5,\,5.5)
  • (e) 2.12 km
  • (g) (4,2)
  • (h) (12,11), 5 km.

From the book

Photon Guidebook: Mathematics HL Paper 3 for the IB Diploma

Chapter 17 teaches practice papers: applications and interpretation hl: how the IB builds this kind of Paper 3 question, the techniques, marked worked investigations, and practice investigations like these.

About the book